レポート・報告書
アジ研ポリシー・ブリーフ
No.158 Impact of Economic Sanctions against Russia on the Global Economy Using the IDE-GSM
S. Kumagai, K. Hayakawa, T. Gokan, I. Isono, S. Keola, and K. Tsubota
PDF (567KB)
- When trade between Russia and all other countries is blocked for a year, the impact on the world economy would be −0.7%. By country, the impact on Russia would be −15.8%, China −0.9%, the EU −0.5%, the US −0.1%, and Japan −0.1%. The relatively large impact on China is due to the close economic ties between China and Russia, as well as the fact that railway logistics through the Trans-Siberian Railway section of Trans-Eurasia Logistics would be blocked.
- However, when China does not join the economic sanctions, the impact on Russia would be much smaller (−4.6%). The impact on Russian regions closer to Europe would be relatively large, whereas the impact on the Eastern region of the Urals would be small. China’s participation is important for the effectiveness of the economic sanctions on Russia.
- As the Central Asian countries and Mongolia will be severely adversely affected by economic sanctions against Russia, these countries would have to be supported.
Introduction
Russia’s invasion of Ukraine, which began on February 24, 2022, continued as of March 17, 2022, with many civilian casualties. Although the North Atlantic Treaty Organization has not moved to intervene militarily in response to Russia’s invasion, major countries, such as the US, the EU, and Japan, have imposed economic sanctions, including the exclusion of some Russian banks from the SWIFT payment system, so trade in goods has been affected.
What will be the impact of these economic sanctions on Russia and the global economy? How will the nonparticipation of China in the sanctions affect the effectiveness of the sanctions? In this policy brief, we estimate the impact of the sanctions on each country and region using the Geographical Simulation Model (GSM) developed by the Institute of Developing Economies (IDE) in 2007.
The IDE-GSM is a computable general equilibrium model based on spatial economics. The IDE-GSM is used to analyze the economic effects of international infrastructure development. In the IDE-GSM, various calculations can be performed by changing the settings of trade costs, such as tariffs, nontariff barriers, and transportation costs1.
We estimate the impact on the economies of each country and region under the following two scenarios: (1) a case in which trade between Russia and all other countries is blocked because of full economic sanctions against Russia and (2) a case in which trade between Russia and all countries, except China, is blocked.
Scenarios
The simulations of the impact of economic sanctions on Russia are conducted under the following scenarios.
Baseline: A case in which no economic sanction is imposed on Russia. This is a business-as-usual scenario and is the subject of comparison for the latter two scenarios.
Full sanctions: A case in which prohibitive costs are imposed on trade between all countries and Russia.
Sanctions excluding China: Prohibitive costs are imposed on the trade between Russia and all countries, except China; trade between Russia and China is assumed to continue as usual.
Assuming that sanctions will be imposed for a year in 2022, the baseline scenario and the sanctions scenario are compared as of 2022, and the difference in GDP of each country and region is considered as the impact of the economic sanctions.
In the case of “full sanctions,” instead of increasing trade costs between Russia and all countries individually, prohibitively high costs will be imposed at the borders of all countries bordering Russia on land and sea, as well as direct flights between Russia and other countries. This will make railway logistics via the Trans-Siberian Railway section of Trans-Eurasia Logistics between China and Europe impossible.
However, in the “sanctions excluding China” scenario, passage will be allowed for all land, sea, and air routes between Russia and China. Russia’s land, sea, and air routes with all countries, except China, will be blocked at the border checkpoints, similar to the setting in the case of full sanctions. This means that trade between Russia and other countries will be possible via China, but exports from Moscow to Europe will be rerouted via the Trans-Siberian Railway to the port of Dalian, China, and then to Amsterdam. This rerouting is expected to increase transportation costs significantly and decrease trade.
In fact, not all countries have joined in sanctions against Russia, which is evidenced by the fact that 141 countries voted in favor of the resolution condemning Russia at the UN, whereas four countries voted against it, and 47 countries abstained or did not vote. Moreover, regarding the sanctions, the suspension of logistics on all Russian borders, as assumed in the simulation, is the most severe situation, and the actual sanctions would not be as severe as this. Therefore, the simulation results presented here consider the impact of the most severe case possible. In addition, in this simulation, we have not taken the following into account: (1) the ban on crude oil and natural gas imports from Russia will cause a temporary surge in resource prices during the global supply and demand adjustments; (2) the exclusion of some Russian banks from SWIFT will have a financial impact on Russia’s economy; (3) the substantial depreciation of the Ruble and uncertainty about the global economic outlook will have an impact on the stock market. Thus, the analysis here focuses on the effects of blocking trade in goods and services.
Results
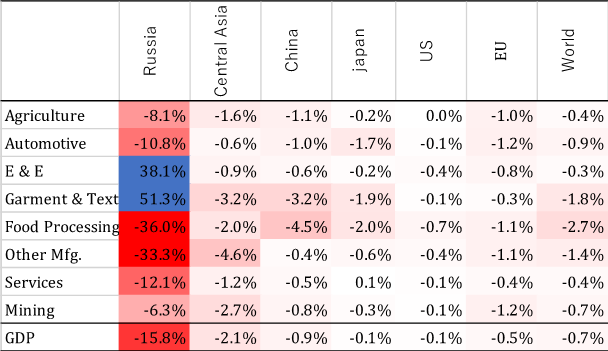
Table 1 presents the impact of a year of “full sanctions” by industry and country/region. As a percentage of GDP, the impact on the global economy is −0.7%. Russia (−15.8%) is the most negatively affected, followed by Central Asian countries (−2.1%) and China (−0.9%). Although it is not listed in the table, Mongolia (−3.8%) is also significantly affected. This result reveals the impact of the unavailability of logistics via the Trans-Siberian Railway section of Trans-Eurasia Logistics2, as these countries have close economic ties with Russia.
However, the impact on the EU (−0.5%), the US (−0.1%), and Japan (−0.1%) is relatively small. This is because based on GDP, Russia’s economy is relatively small, close to that of South Korea and Brazil, approximately 7% of that of the US and 10% of that of Europe and China. It can also be because our simulations do not fully consider the impact of rising prices of crude oil, natural gas, and rare metals, in which Russia holds a certain share of the global market.
By industry, for Russia, the negative impact on food processing (−36.0%) and other manufacturing industries (−33.3%), such as steel and chemical products, is significant. However, there is a fairly large positive impact on electronics and electrical machinery as well as textiles and clothing industries. This result is somewhat disconcerting but understandable as the share and output of these industries in the Russian economy is small, and Russia imports more than it exports. Therefore, the economic sanctions will result in domestic production, which will serve as import substitution.
Table 1: Impact of One-year Full Sanctions (2022 vs. the Baseline)

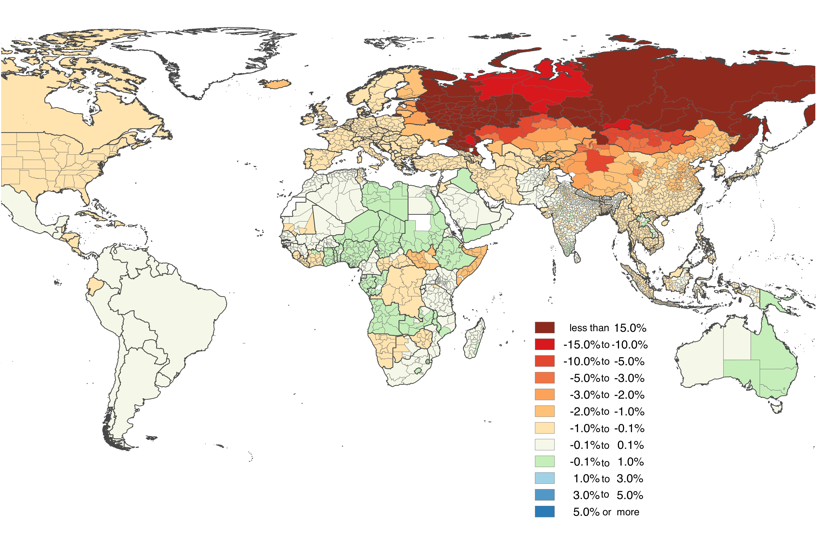
Figure 1 depicts the impact of the one-year “full sanctions” scenario by region and compares it with the baseline. Red indicates regions negatively impacted by the sanctions, and blue indicates regions positively impacted. Although there are some small differences, there are significant negative impacts across the industries in Russia. Moreover, relatively large impacts are also seen in Central Asian countries and Mongolia, Eastern European countries neighboring Russia, and western and northern China. We also see that African countries are negatively and positively affected but to a small extent.
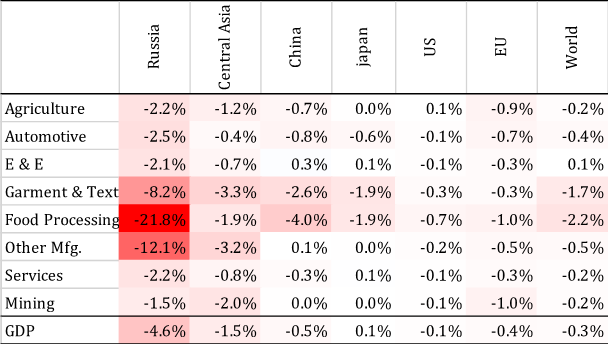
Table 2 presents the impact of the one-year “sanctions excluding China.” The impact on the global economy is −0.3%. Russia (−4.6%) is the most disadvantaged, but the magnitude of the impact is much smaller than that of the “full sanctions” scenario. Other countries that are negatively affected are Central Asian countries (−1.5%) and China (−0.5%). Mongolia (−3.4%) is also affected, although it is not listed in the table.
Figure 1: Impact of One-year “Full Sanctions” (2022 vs. Baseline)

Note: The boundaries on the map are based on gadm.org and
do not imply endorsement or judgment by the IDE or JETRO on
the attribution of sovereignty.
However, under this scenario, the impact on the EU (−0.4%) and the US (−0.1%) is smaller than that under the “full sanctions” scenario and is slightly positive on Japan (0.1%). By industry, the negative impact on Russia’s food processing (−21.8%) and other manufacturing (−12.1%) industries is greater but less than half in the “full sanctions” scenario. The negative impact on electronics and electric machinery as well as textiles and clothing industries suggests that the import substitution that occurred in the “full sanctions” scenario disappeared in this scenario.
In the setting of this simulation, in addition to trade between Russia and China, trade between all other countries and Russia via China is possible, which is the main reason for the smaller impact on Russia. However, if China does not join the sanctions against Russia, this type of circumvented trade would occur, and it corresponds to the real situation to some extent.
Table 2: Impact of One-year Sanctions Excluding China (2022 vs. Baseline)

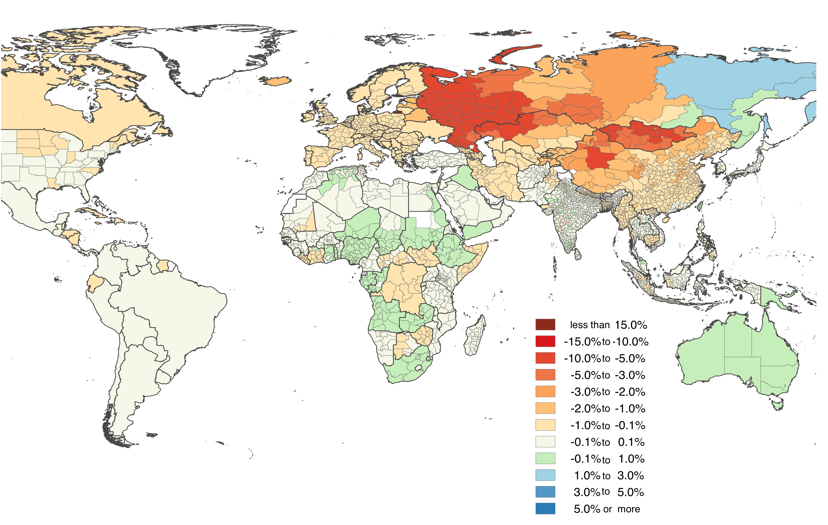
Figure 2 depicts the impact of the one-year “sanctions excluding China” by region with the baseline comparisons. Red indicates regions negatively impacted by the sanctions, and blue indicates regions positively impacted. For Russia, the impact on regions close to Europe is large, whereas the impact on regions east of the Urals is smaller than in the scenario of full sanctions. The positive impact on the Far Eastern region is due to its proximity to China. The pattern of the impact on neighboring countries is similar to that of the “full sanctions” scenario.
Figure 2: Impact of One-year “Sanctions Excluding China” (2022 vs. Baseline)

Note: The boundaries on the map are based on gadm.org and
do not imply endorsement or judgment by the IDE or JETRO on
the attribution of sovereignty.
Conclusion
The results reveal that the imposition of full sanctions against Russia would have a significant negative impact on the Russian economy. It is also found that a relatively large impact would be felt in China, as well as Mongolia and Central Asian countries. The negative impact on these countries may be attributed to the fact that cargo to Europe via the Trans-Siberian Railway section of Trans-Eurasia Logistics will be halted. This is because, under the “sanctions excluding China” scenario, the impact on China will not be significantly reduced compared with that of the “full sanctions” scenario.
However, if China does not impose sanctions against Russia, the negative impact on the Russian economy will be much smaller. It is found that for the economic sanctions to be effective, China should join the sanctions.
We also find that the economic sanctions against Russia will have a fairly large negative impact on Mongolia and Central Asian countries. It is unclear how long Russia’s invasion of Ukraine will last, but if the economic sanctions are to be continued, these countries would have to be supported.
In this policy brief, we adopt a rather extreme setting in which logistics between Russia and all other countries are cut off to conduct a simulation. In reality, some countries would not impose economic sanctions, and trade would not be completely halted. In terms of logistics, the difficulty for aircraft to fly over the Russian territory will have a surprisingly large impact. In a future study, it will be necessary to conduct simulations based on detailed scenarios that take these points into account.
(Satoru Kumagai, Kazunobu Hayakawa, Toshitaka Gokan, Ikumo Isono, Souknilanh Keola, and Kenmei. Tsubota)
- In IDE-GSM, each country/region’s GDP changes through changes in the supply and demand of goods, prices, population, and industrial agglomeration with the changing trade costs through a broad definition, such as tariffs, nontariff barriers, and transportation costs. Here the GDP is compared by country, region, and industry under the scenarios assumed and the baseline scenario in 2022 to determine the economic impact.
- According to RailFreight.com, the cargo transport between China and Europe by rail is rapidly increasing and reached 1.46 million TEU in 2021. The volume of rail cargo transport by sea between China and Europe is estimated to have reached approximately 10% of the total cargo transported.
The views expressed in the document are those of the author(s) and neither the Institute of Developing Economies nor the Japan External Trade Organization bears responsibility for them. ©2022 by author(s)


