レポート・報告書
アジ研ポリシー・ブリーフ
No.147 Economic Impacts of the Regional Comprehensive Economic Partnership: Analysis Using IDE-GSM
PDF (1MB)
- The impact of RCEP tariff reductions on member economies is estimated using a general equilibrium model called IDE-GSM. Tariff rates as of 2019 are used as a baseline, and we assume that RCEP tariffs become available in 2021. Japan’s GDP is expected to increase by 0.66% in 2030. In addition to Japan, the positive effects on South Korea (0.24%) and China (0.13%) are significant.
- The scenario assuming India’s accession to the RCEP shows an increase of 0.64% in the country’s GDP in 2030 compared with the actual RCEP.
- Assuming that either Japan or China does not join the RCEP, Japan, followed by China, will experience the most significant negative impacts. This regional trade agreement is the first to bring together Japan and China, which is at the core of the economic merits of the RCEP.
Introduction
On November 15, 2020, 15 countries, namely Japan, China, South Korea, Australia, New Zealand, and 10 ASEAN member countries, signed the Regional Comprehensive Economic Partnership Agreement (RCEP) eight years after the declaration of the negotiations starting in November 2012. However, India withdrew from the negotiations in November 2019 and did not participate in the RCEP.
The region covered by the RCEP has complex overlaps of various bilateral and multilateral regional trade agreements (RTAs), primarily the ASEAN Free Trade Area. Therefore, the detailed estimates of economic effects of the RCEP are limited in the public. Here, the impact on each country and region is estimated using the Institute of Developing Economies’ Economic Geography Simulation Model (IDE-GSM).
The IDE-GSM is a computable general equilibrium model based on spatial economics developed in 2007 by the IDE. The IDE-GSM is used to analyze the economic effects of international infrastructure development. In the IDE-GSM, various calculations can be performed by changing trade cost settings, such as tariffs, nontariff barriers, and transportation costs1.
In this study, the economic impacts are estimated for the following four scenarios: (1) The RCEP with 15 countries (RCEP15), (2) the RCEP with India (RCEP15 + I), (3) the RCEP without Japan (RCEP15 − J), and (4) the RCEP without China (RCEP15 − C). The four scenarios’ economic effects were estimated against the baseline scenario.
Scenarios
A simulation of the RCEP’s economic impacts was conducted for the following scenarios.
Baseline: Assume that the RCEP does not exist and that each country’s tariffs remain at their 2019 rate (see below for details).
RCEP15: Assume that the 15-country RCEP enters into force in 2021.
RCEP15 + I: Assume that India joins RCEP15 in 2021. Regarding India’s tariffs when it joins the RCEP, tariffs for pairs with countries with which it already has an RTA are assumed to remain the same as those in the baseline scenario. For pairs with countries for which the RCEP is the first RTA with India, tariff rates are applied with reference to other RTAs2.
RCEP15 − J: The same tariff rates as those in RCEP15 are applied for RCEP members other than Japan. For country pairs including Japan, tariff rates are assumed to remain the same as those in the baseline scenario.
RCEP15 − C: The same tariff rates as those in RCEP15 are applied for the RCEP members other than China. For country pairs with China, tariff rates are assumed to remain the same as those in the baseline scenario.
Here, the RCEP15 scenario is compared with the baseline scenario for 2030. In the other three scenarios are compared with the RCEP15 scenario. The difference in the GDP of each country/region is considered the economic impact of the targeted scenario. We focus on the effect of tariff reduction and does not consider the effects of changes in non-tariff measures (e.g., expanding cumulation base or reducing non-tariff barriers).
The preferential tariff rates set by the RCEP are obtained from the RCEP agreement, whereas the tariff data for the baseline scenario are obtained from World Integrated Trade Solutions and Tariff Analysis Online, which are maintained by the World Trade Organization and other organizations.
A crucial feature of the RCEP is that at least one RTA is already in effect for all country pairs, excluding those between China and Japan and between Japan and Korea. Therefore, the tariff rates made available by the existing RTAs in the baseline scenario must be taken into account. In our model, tariff rates (including RTA preferential rates) until 2019 were incorporated. However, given the data constraints, the model includes tariff rates as of 2018 for Korea and Thailand and as of 2014 for Malaysia.
The baseline scenario assumes that these tariff rates in the latest year continue to be imposed thereafter. Therefore, the tariff reduction schedule after the latest year, which is determined by the existing RTAs, is not considered. By contrast, the future tariff reduction schedule under the RCEP is taken into account based on the agreement. Therefore, as time progresses, the RCEP tariff rate are likely to be lower than the preferential rate under the existing RTAs.
Given our ignoring this gradual reduction in tariffs by the existing RTAs, the economic impact of the RCEP in this simulation analysis is slightly overestimated. However, because existing analyses of the economic effects of the RCEP do not reflect even the tariff rates as of 2019—let alone the phased reduction of tariffs under the existing RTAs—the results of our analysis are considered more precise than those of the existing analyses.
Results
Table 1 shows the economic impacts of RCEP15 based on the country/region and industry. As a percentage of the GDP, Japan benefits the most from RCEP15 (0.66%), followed by South Korea (0.24%) and China (0.13%), because no RTAs existed between China and Japan or between Japan and Korea before the RCEP. Therefore, having these country pairs included in the RCEP offers them a significant advantage. In terms of industries, Japan’s textiles (3.01%), other manufacturing (2.28%), and food processing (1.29%) industries have experienced significant benefits.
Table 1: Economic impacts of RCEP15 (2030, compared with baseline, %)
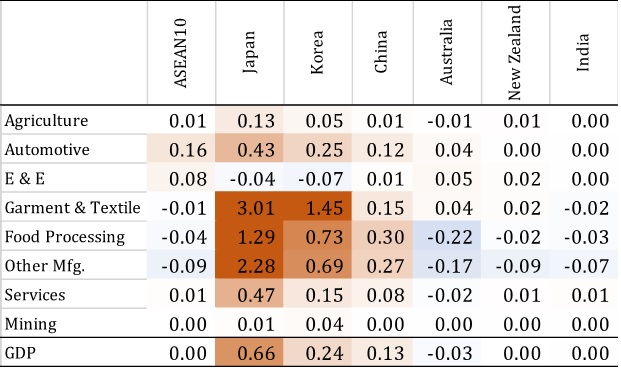
Figure 1: Economic impacts of RCEP15 (2030, compared with baseline)
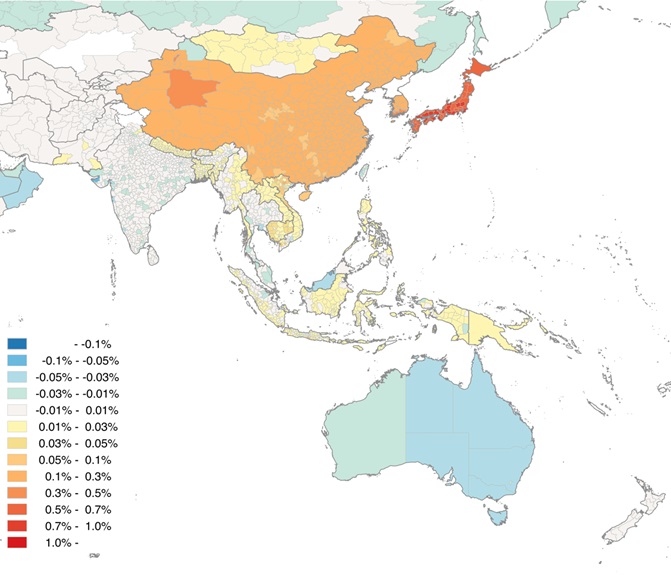
Table 2 provides the economic impact of RCEP15 + I assuming India’s accession relative to RCEP15: India (0.64%) will benefit the most from its accession to the RCEP, whereas Australia (0.16%), New Zealand (0.18%), and China (0.09%) will receive significant benefits because no RTAs exist between India and these three countries. Based on the industry, India’s other manufacturing (1.90%), textiles and clothing (1.31%), and automobiles (1.05%) will benefit substantially.
Table 2: Economic impacts of RCEP15 + I (2030, compared with RCEP15, %)
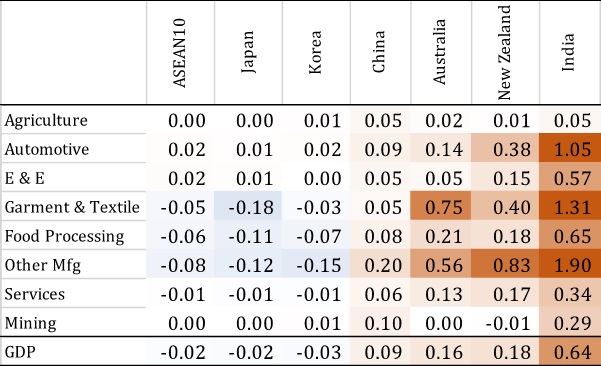
Table 3 shows the impact of assuming that Japan did not join the current RCEP15 relative to RCEP15. Japan has the largest negative impact (–0.65%), followed by China (–0.11%). For South Korea, the negative impact is considered smaller because it has an advantage in trade with China over Japan, which is assumed to be outside the RCEP in this scenario.
Table 3: Economic impacts of RCEP15-J (2030, compared with RCEP15, %)
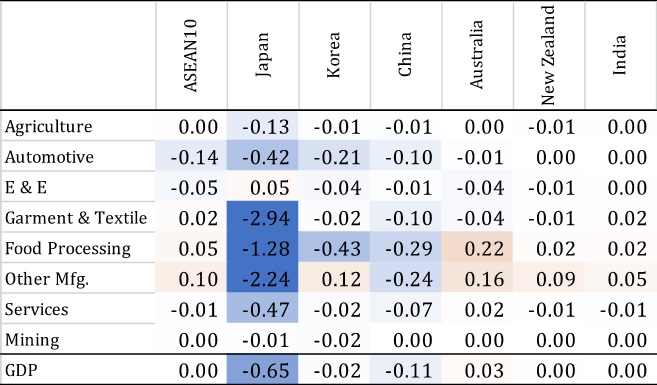
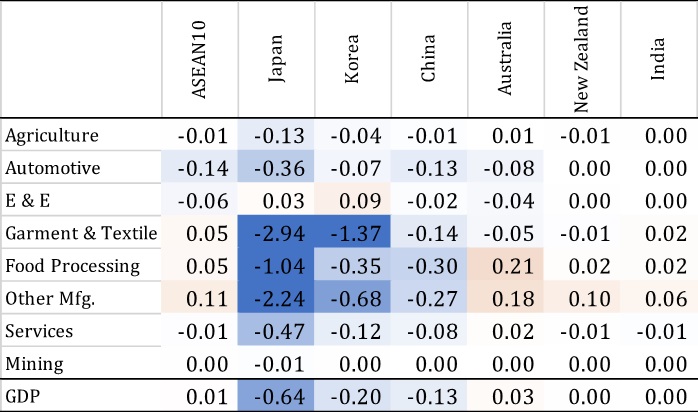
Table 4 shows the impact of assuming that China does not join the current RCEP15 relative to RCEP15. The strongest negative impact is on Japan (–0.64%), followed by South Korea (–0.20%) and China (–0.13%). The majority of the advantages of the RCEP as an RTA involving China, Japan, and South Korea will be lost if China does not join.
Table 4: Economic impacts of RCEP15-C (2030, compared with RCEP15, %)
Conclusion
Although only the effect of tariff reductions was evaluated, Japan can gain considerable benefits from the RCEP. The IDE-GSM estimates indicate that India would have benefited significantly from joining the RCEP, particularly economically. Although India’s participation in the RCEP did not ultimately materialize, it is reasonable to assume that this decision was political rather than economic interests, given the deterioration of Sino–Indian relations and the domestic political situation.
Assuming that Japan or China did not join the RCEP, the country that did not join would be negatively affected, and the benefits of the RCEP would be considerably less for the countries that joined. In terms of tariff reductions, the core benefit of the RCEP is that, it is arguably the first RTA to bring together Japan and China.
- In IDE-GSM, each country/region’s GDP changes through changes in the supply and demand of goods, prices, population, and industrial agglomeration with the changing trade costs through a broad definition, such as tariffs, non-tariff barriers, and transportation costs. Here, the GDP is compared by country, region, and industry between the scenarios assumed and the baseline scenario in 2030 and with regards to the economic impact.
- For exports from China to India, India’s 2019 tariff rate under the ASEAN–India RTA will be applied. For exports from India to China, China’s 2019 tariff rate under the ASEAN–China RTA will be applied. Exports from Australia and New Zealand to India are subject to India’s 2019 tariff rate under the Japan–India RTA. Exports from India to Australia are subject to Australia’s 2019 tariff rate under the Australia–China RTA. Exports from India to New Zealand are subject to New Zealand’s 2019 tariff rate under the China–New Zealand RTA.
(Satoru KUMAGAI and Kazunobu HAYAKAWA)
The views expressed in the document are those of the author(s) and neither the Institute of Developing Economies nor the Japan External Trade Organization bears responsibility for them. ©2021 by author(s) No part of this publication may be reproduced without the prior permission of the author(s).


