


Myanmar Economy Viewed at Night
Policy Review on Myanmar Economy
No.5
August 2012
PDF (548KB)
PDF (Burmese) (742KB) BUSINESS , Union of Myanmar Federation of Chambers of Commers & Industry, Vol.15 No.12, December 2012.
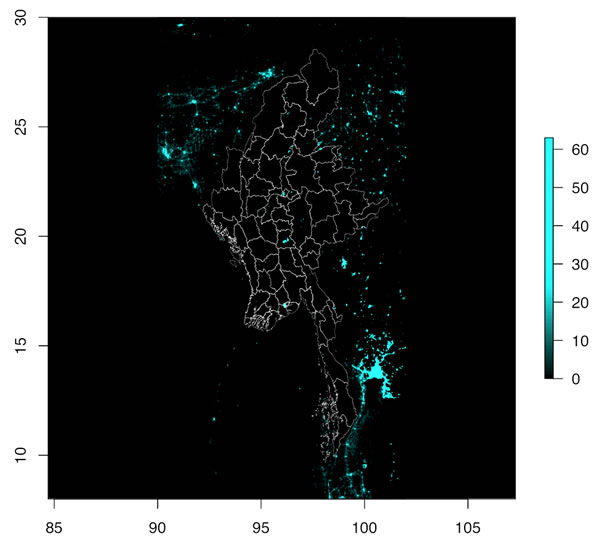
Figure 1 Nighttime Lights
Imagery of Myanmar
Imagery of Myanmar
(Source) Image and data processing
by NOAA's National Geophysical
Data Center. DMSP data collected
by US Air Force Weather Agency.
by NOAA's National Geophysical
Data Center. DMSP data collected
by US Air Force Weather Agency.
Myanmar’s official statistics provide considerably outdated and narrowly covered data on the country’s economic and industrial situation. Data on geographical economic activities are particularly lacking. However, it is critically important for policy makers to know what the economic geography is like in Myanmar when they envisage sustainable and balanced economic development.
An alternative way invented to estimate economic activities in developing countries is to use the strength and distribution of nighttime lights. It is now widely known that the strength of nighttime lights and economic activity are firmly correlated. Normally, the relationship between these two data is determined by some coefficients derived from regression analyses using ‘actual’ data and nighttime lights satellite imagery (Ghosh et al. 2010). Here, we use the nighttime lights to estimate the distribution of GDP at a district level (Figure 1), taking the national GDP as given.
An alternative way invented to estimate economic activities in developing countries is to use the strength and distribution of nighttime lights. It is now widely known that the strength of nighttime lights and economic activity are firmly correlated. Normally, the relationship between these two data is determined by some coefficients derived from regression analyses using ‘actual’ data and nighttime lights satellite imagery (Ghosh et al. 2010). Here, we use the nighttime lights to estimate the distribution of GDP at a district level (Figure 1), taking the national GDP as given.
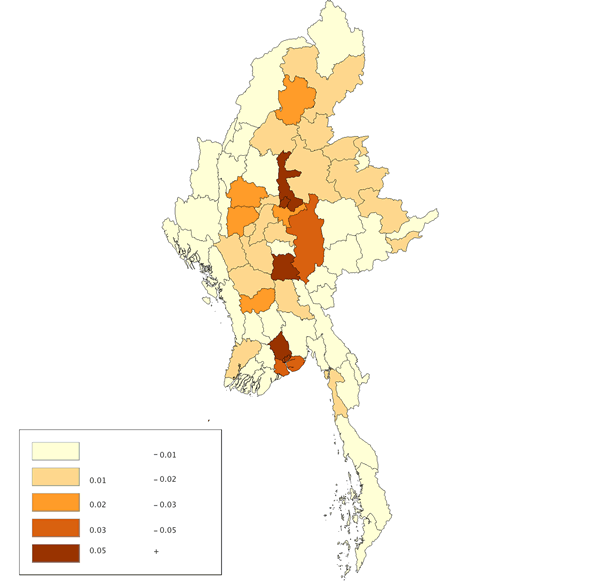
Figure 2 Nighttime Light Share
by District (2009)
by District (2009)
Figure 2 shows the distribution of the nighttime lights by district. There are three regions with a more than 5 percent share of the national nighttime lights, namely Yangon, Mandalay (with Pyin Oo Lwin) and Nay Pyi Taw.
These three regions in total emit around 40 percent of national nighttime lights. In particular, Yangon, the former national capital, emits 22 percent of the national nighttime lights. This is consistent with the electrification data in Myanmar. The electrification ratio in Yangon was 61 percent in 2008, while that of the rest of the country was only 16 percent in the same year. Mandalay is the largest commercial town in Upper Myanmar. Nay Pyi Taw is the new capital city with all the governmental organizations. Although Nay Pyi Taw still lacks substantial industrial activities, it is given the first priority for electricity. Other local cities are much smaller than Yangon and Mandalay.
These three regions in total emit around 40 percent of national nighttime lights. In particular, Yangon, the former national capital, emits 22 percent of the national nighttime lights. This is consistent with the electrification data in Myanmar. The electrification ratio in Yangon was 61 percent in 2008, while that of the rest of the country was only 16 percent in the same year. Mandalay is the largest commercial town in Upper Myanmar. Nay Pyi Taw is the new capital city with all the governmental organizations. Although Nay Pyi Taw still lacks substantial industrial activities, it is given the first priority for electricity. Other local cities are much smaller than Yangon and Mandalay.
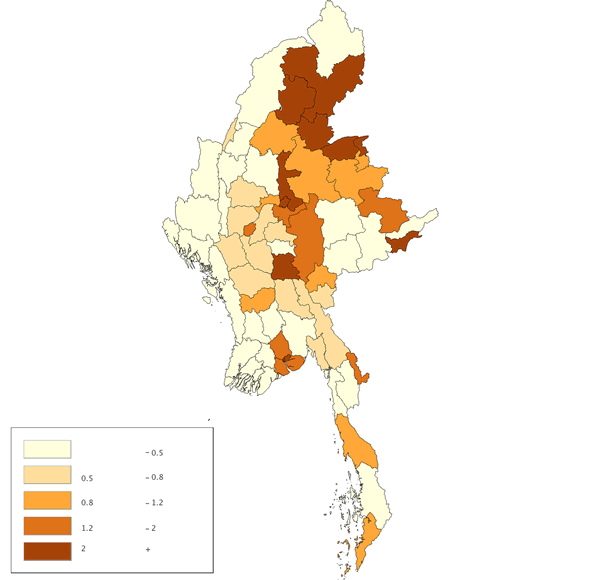
Now, we proceed to a ‘preliminarily’ estimate of per capita GDP by district using the limited information available. First, population by district is estimated based on the share of eligible voters in the general elections held in November 2010 and the 1983 population census. Second, GDP by district is estimated assuming that non-agricultural economic activities are distributed as the same share as the nighttime lights, while agricultural production is distributed as the same share as the share of agricultural land of each district.
Figure 3 Estimated GDP
Per Capita by District (2009)
Per Capita by District (2009)
Figure 3 shows the estimated GDP per capita by district (national average = 1.0). The three core regions Yangon, Mandalay (with Pyin Oo Lwin) and Nay Pyi Taw are more than two times richer than the national average. In addition to that, some districts at the national border with Thailand (Tachileik and Myawaddy) and with China (Laukkaing, Muse and some districts in Kachin State) have a higher per capita GDP than the national average, while no border-city effect is observed for districts at the national border with India and Bangladesh.
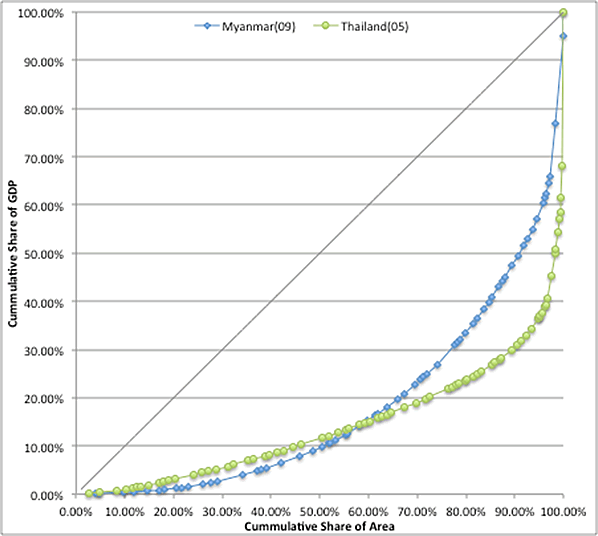
Figure 4 compares the spatial distribution of GDP in Myanmar for 2009 and in Thailand for 2005. The figure is the so-called ‘Lorenz curve’. The horizontal axis is the cumulative share of area and the vertical axis is the cumulative share of GDP. If economic activities are distributed with perfect equality, the points line up on the 45-degree line. The more the distribution of economic activities becomes uneven, the more the curve becomes convex.
Figure 4 compares the spatial distribution of GDP in Myanmar for 2009 and in Thailand for 2005. The figure is the so-called ‘Lorenz curve’. The horizontal axis is the cumulative share of area and the vertical axis is the cumulative share of GDP. If economic activities are distributed with perfect equality, the points line up on the 45-degree line. The more the distribution of economic activities becomes uneven, the more the curve becomes convex.
Figure 4 Spatial Distribution of
GDP in Myanmar and Thailand
GDP in Myanmar and Thailand
Figure 4 shows that the economic activities in Myanmar are less concentrated compared with those in Thailand. In Thailand, more than 60 percent of national GDP is concentrated in less than 5 percent of the land area. In Myanmar, the same 60 percent of national GDP is concentrated in about 15 percent of the land area.
There is a tendency for the economic development in developing countries to accelerate the concentration of economic activities. So the economic activities in Myanmar are also likely to be more concentrated in the future.
There is a tendency for the economic development in developing countries to accelerate the concentration of economic activities. So the economic activities in Myanmar are also likely to be more concentrated in the future.
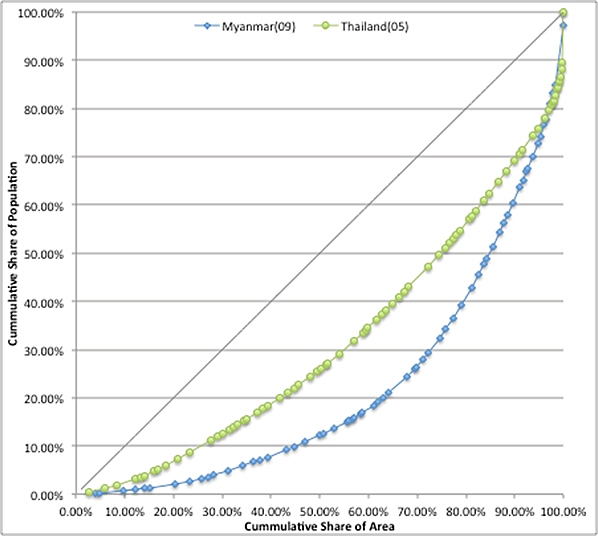
Figure 5 Spatial Distribution of
Population in Myanmar and Thailand
Population in Myanmar and Thailand
On the other hand, Figure 5 compares the spatial distribution of population in Myanmar for 2009 and in Thailand for 2005. The population in Myanmar is already spatially more concentrated than that in Thailand. This is partly because Myanmar contains some mountainous areas where the population density is low.
Based on analysis of the distribution of nighttime lights in Myanmar, we may have some implications on the country’s economic and industrial activities.
Last but not least, there are long-standing questions about the trade-off between economic efficiency and regional equality. Some recent studies, however also suggest that the trade-off may only exist under certain circumstances. For instance, Meyer and Lackenbauer (2005) proposed a ‘two step regional policy approach’, which concentrates on richer regions first before addressing disparity later. Brülhart and Sbergami (2009) argued that the trade-off happens for economies of per capita income up to 10,000 USD. Therefore, it is indispensable to construct reliable geo-economic data for policy makers in order to balance these two objectives by careful economic and social policies.
Based on analysis of the distribution of nighttime lights in Myanmar, we may have some implications on the country’s economic and industrial activities.
- The Yangon-Nay Pyi Taw-Mandalay route would be a possible industrial corridor, considering that non-agricultural activities, including manufacturing and administrative services, have already agglomerated in these three regions.
- This study suggests that eastern border cities could develop through closer links with their emerging neighbors, i.e., China and Thailand. On the contrary, western border cities have thus far failed to develop through their neighbors, i.e., India and Bangladesh. However, given the experiences of border cities with China and Thailand, there are ways for the western border cities to develop via enhanced connectivity with emerging India and Bangladesh.
Last but not least, there are long-standing questions about the trade-off between economic efficiency and regional equality. Some recent studies, however also suggest that the trade-off may only exist under certain circumstances. For instance, Meyer and Lackenbauer (2005) proposed a ‘two step regional policy approach’, which concentrates on richer regions first before addressing disparity later. Brülhart and Sbergami (2009) argued that the trade-off happens for economies of per capita income up to 10,000 USD. Therefore, it is indispensable to construct reliable geo-economic data for policy makers in order to balance these two objectives by careful economic and social policies.
References
- Brülhart, Marius; and Frederica Sbergami. [2009] “Agglomeration and Growth: Cross-country Evidence” Journal of Urban Economies , Vol. 65, 48-63.
- Ghosh, Tilottama; Rebecca L. Powell; Christopher D. Elvidge; Kimberly E. Baugh; Paul C. Sutton; and Sharolyn Anderson. [2010] “Shedding Light on the Global Distribution of Economic Activity” The Open Geography Journal , 2010(3), 148-161.
- Meyer, Dietmar; and Jörg Lackenbauer. [2005] “EU Cohesion Policy and the Equity-Efficiency Trade-off – Adding Dynamics to Martin’s Model” ERSA Conference Paper.
You can download this policy review at the IDE-JETRO website: http://www.ide.go.jp
Contact: Bangkok Research Center, JETRO Bangkok TEL:+66-2253-6441 FAX:+66-2254-1447