IDE Research Columns
Column
How Will the US-China Trade War Affect Asian Economies?
Satoru KUMAGAI
Institute of Developing Economies, JETRO
September 2022
The Geographical Simulation Model of the Institute of Developing Economies (IDE-GSM) estimates the following economic impact of the US-China trade war: −0.4% (of GDP) for the US, −0.5% for China, and +0.1% for East Asia (excluding China). Moreover, the electronics and electrical machinery sectors in both the US and China will suffer significantly. By contrast, the electronics and electrical machinery sectors in East Asia could benefit from this trade war. Although the US-China trade war benefits East Asian countries, for the time being, they are more vulnerable to US tariff increases than China, and it would be preferable to bring the US back into multilateral trade negotiations in a concerted effort.
Computable General Equilibrium Model Analysis about the US-China Trade War
The US-China trade war began in July 2018, when US President Donald Trump imposed tariffs of 25% on 818 Chinese goods valued at 34 billion USD. Then, President Trump and President Xi Jinping of China negotiated to resolve various trade issues, including exchange rates and intellectual property rights. However, the agreement had not been reached under the Biden administration, which took over the Trump administration.
Although it is natural to expect that the trade war between the US and China will harm the global economy, detailed country-by-country economic impact estimates have been limited. Using the IDE-GSM, we estimate the economic impact of the trade war on the US-China, and Asian economies.
The IDE-GSM is a spatial economics-based computable general equilibrium model developed by the IDE-JETRO since 2007 (Kumagai et al. 2013). International organizations, such as the Economic Research Institute for ASEAN and East Asia, the World Bank, and the Asian Development Bank, use the model to assess the economic consequences of international infrastructure development projects. Because tariff data are considered in the IDE-GSM trade cost calculations, we can estimate the global economic impact of a reciprocal tariff hike between the US and China.
Trade War Scenarios
Two trade war scenarios are analyzed here. In the first scenario, we consider a “worst-case” bilateral trade war scenario in which tariffs between the US and China are raised by 25% for 3 years beginning in 2019 on all items compared to pre-2018 levels. The second scenario assumes a “the US versus the World” trade war in which the US and all other countries impose additional 10% tariffs on all goods for three years beginning in 2019, although the validity of this scenario has diminished in the Biden administration. The economic impact on each country and region is calculated by comparing the GDP under the trade war scenario as of 2021 to the “baseline” GDP projection in the absence of the trade war.
Limited Impact of the Bilateral Trade War on the World Economy
Figure 1 depicts the estimated impact of the “worst-case” US-China trade war scenario on each country’s economy in 2021. The effect on the US economy is −0.4% (percent of GDP). Meanwhile, the impact on the Chinese economy is −0.5% (percent of GDP), which is slightly greater than the impact on the US economy.
For the East Asia region, excluding China (Japan, South Korea, Taiwan, the 10 ASEAN countries, and India), Malaysia (0.5%) and Taiwan (0.4%), among others, incurred a positive impact. Meanwhile, the total impact on the East Asian region, excluding China, is positive at 0.1%, and that on the Japanese economy is also positive at 0.2%. This is due to the substitution of some trade between the US and China with third-country trades to avoid high tariffs.
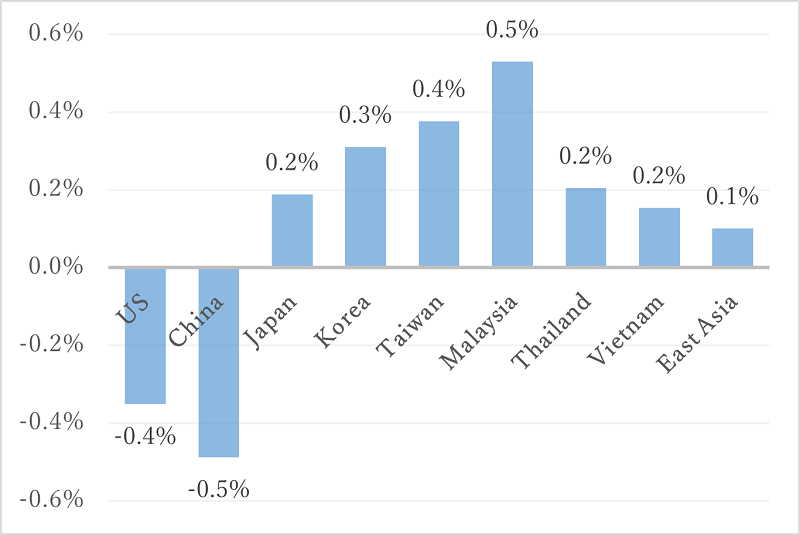
Figure 1. US-China Trade War “Worst-Case” Impact by Industry
(2021, % of Baseline GDP)
Source: Authors’ own illustration based on Kumagai et al. (2021).
Table 1 depicts the “worst-case” impact of the US-China trade war on each country and region by industry. The electronics and electrical machinery (E&E) industry has had the greatest impact, with a −12.4% impact in the US and a −7.5% impact in China. Because the E&E sector has low tariff rates and low transportation costs relative to the price of goods, a 25% tariff would have a significant impact on this industry. However, the impact on the E&E sectors in East Asia, excluding China, is positive at 2.8%.
Table 1. US-China Trade War “Worst-Case” Impact by Industry
(2021, % of Baseline GDP)
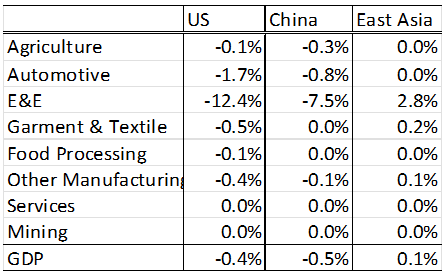
Source: Authors’ own work based on Kumagai et al. (2021).
The Economist Intelligence Unit (EIU) has published a list of the “winners” of the US-China trade war by economic sector. Malaysia and Vietnam are nominated as the winners with substantial benefits in the information and communications technology sector. Meanwhile, in the readymade garments sector, Bangladesh, Vietnam, and India are nominated as winners with significant benefits. For the automotive industry, Malaysia and Thailand are nominated as the winners with substantial benefits (EIU 2018). Thus, the EIU predictions are largely consistent with our simulation results.
Table 2 shows the five states/provinces that have suffered the most from the trade war. For US states, California is the worst hit by the trade war, followed by Texas and Massachusetts. Meanwhile, among Chinese provinces, Shenzhen suffers the most, followed by Guangzhou and Fushan. The negative impact on Shenzhen province is 3.3% of the GDP, which is significantly higher than China’s national GDP of 0.5%.
Table 2. Five States/Provinces Hit Worst by the US-China Trade War
(2021, Compared with the Baseline)
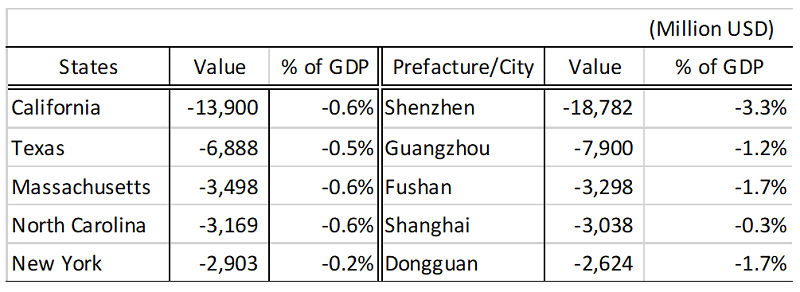
Source: Table 4 in Kumagai et al. (2021).
Figure 2 depicts the estimated impact of a trade war between the US and the rest of the world on each country’s economy as of 2021. The impact on the US is −0.7%, whereas that on China is −0.5%. Taiwan (−7.3%), Malaysia (−4.8%), Thailand (−4.2%), and South Korea (−3.8) are among the countries and regions with the greatest negative impacts, whereas the Japanese economy suffers a −1.2% hit. The negative impact was divided into two industries: automobile and other manufacturing.
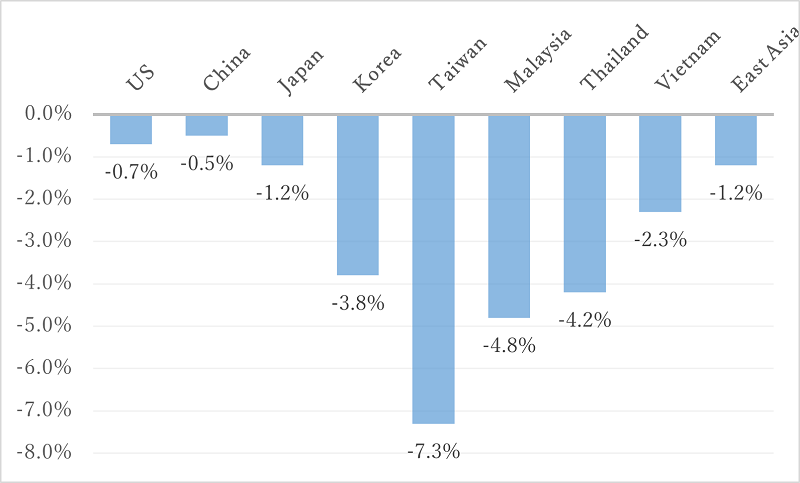
Figure 2. Impact of “The US vs. The World” Trade War
(2021, % of Baseline GDP)
Source: Authors’ own illustration based on Kumagai et al. (2021).
Pull the US Back to the Multilateral Trade Negotiations
As previously discussed, the IDE-GSM analysis shows that an escalation of the US-China trade war would affect the US and China by −0.4% and −0.5%, respectively, which is not insignificant for both economies, given that the IMF forecasts GDP growth of 2.3% for the US and 6.3% for China in 2019. However, as long as the trade war remains bilateral, its impact on the global economy will be limited, and some countries, particularly those in the E&E industry, will profit while others fight.
However, suppose bilateral trade negotiations were launched against other countries in the same manner as the US has used against China, a scenario that is unlikely under the Biden administration. In that case, many East Asian countries would be far more vulnerable than China. This is because East Asian countries originally exported a high percentage of their products to the US, and a large portion of their exports are in the E&E industry, which is vulnerable to tariffs.
For the time being, the US-China trade war may represent a “business opportunity” for East Asian countries. However, they should not rejoice in China’s misfortune because the negative consequences of a trade war with the US are far more severe for these countries than for China. To prevent the US from extending similar negotiating methods to other countries, East Asian countries should work together to bring the US back into multilateral trade frameworks, such as TPP and FTAAP.
Authors’ Note
The main research content of this column is based on: Kumagai, Satoru, Toshitaka Gokan, Kenmei Tsubota, Ikumo Isono, and Kazunobu Hayakawa. 2021. “Economic Impacts of the US-China Trade War on the Asian Economy: An Applied Analysis of IDE-GSM.” Journal of Asian Economic Integration 3(2):127–143.
https://doi.org/10.1177%2F26316846211032296
References
Economists Intelligence Unit (EIU). 2018. “Creative Disruption: Asia’s Winners in the US-China Trade War.”
Kumagai, Satoru, Kazunobu Hayakawa, Ikumo Isono, Souknilanh Keola, and Kenmei Tsubota. 2013. “Geographical Simulation Analysis for Logistics Enhancement in Asia.” Economic Modelling 34:145–153.
https://doi.org/10.1016/j.econmod.2013.03.021
Author’s Profile
The Author is the director of the Economic Geography Studies Group at IDE-JETRO and the project leader and lead programmer for the Geographical Simulation Model (IDE-GSM). He mainly conducts research on issues related to international trade and economic development in East Asia, including the Malaysian economy and the middle-income trap. His most recent papers have appeared in the journals Economic Modelling, The Developing Economies, Journal of International Commerce, and Economics and Policy, among others.
Other Articles by This Author
Kumagai Satoru, and Kazunobu Hayakawa. 2021. “Economic Impacts of the Regional Comprehensive Economic Partnership: Analysis Using IDE-GSM.” IDE Policy Brief No. 147.
https://www.ide.go.jp/Japanese/Publish/Reports/AjikenPolicyBrief/147.html
*The views expressed in the columns are those of the author(s) and do not represent the views of IDE or the institutions with which the authors are affiliated.
**Thumbnail image: https://twitter.com/USTradeRep/status/1098620266702405636
(Official White House Photo by Tia Dufours)


