


Export-Oriented Growth Strategy for Myanmar: Joining Production Networks in East Asia
Policy Review on Myanmar Economy
No.9
Toshihiro KUDO and Satoru KUMAGAI
January 2013
PDF (380KB)
PDF (Burmese) (665KB) BUSINESS , Union of Myanmar Federation of Chambers of Commerce & Industry, Vol.13, No.3, March 2013
Introduction
As Baldwin (2004) argued, mentioning Rodriguez and Rodrik (2001), it is not an easy task to statistically prove the positive relationship between trade openness and economic growth. However, our observations in East Asia after the mid-1980s tell us that it is difficult to conceive how a country could achieve rapid growth without being integrated in the global economy. Virtually, no East Asian country has been able to record high economic growth without a strong export sector, and to do so, the smooth import of intermediate goods is the key, especially at the early stages of export–oriented industrialization.
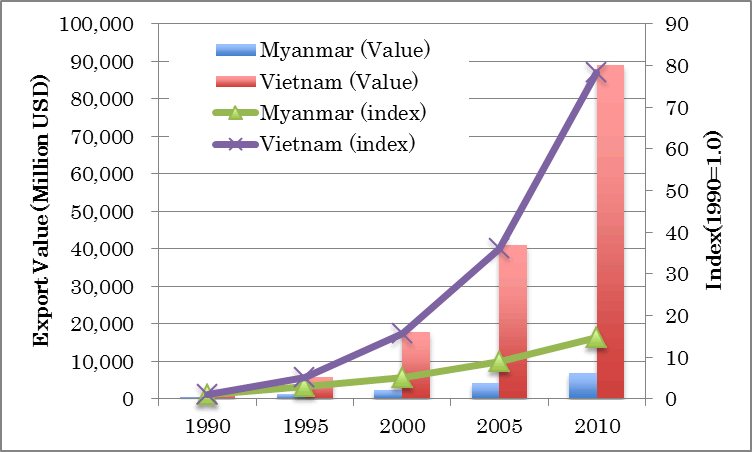
More than twenty years ago, Myanmar also tried to follow this scenario. Soon after the military took power in 1988, the Myanmar government launched a series of open-door policies. It allowed private firms to engage in external trade, and legitimized border trade with its neighboring countries. As a consequence, Myanmar’s foreign trade increased rapidly during the 1990s and the first decade of the twenty-first century. Its exports grew fifteen times for the period of 1990-2010.
Nevertheless, the value of Myanmar’s exports was by far smaller (less than ten percent), than that of Vietnam in 2010 ( Figure 1 ). While Vietnam exported only 2.5 times more than Myanmar did in 1990, it exported more than 13 times the amount Myanmar did in 2010. Even though the two countries started their open-door policies toward the end of the 1980s, why has such a big gap in export performance been created?
As Baldwin (2004) argued, mentioning Rodriguez and Rodrik (2001), it is not an easy task to statistically prove the positive relationship between trade openness and economic growth. However, our observations in East Asia after the mid-1980s tell us that it is difficult to conceive how a country could achieve rapid growth without being integrated in the global economy. Virtually, no East Asian country has been able to record high economic growth without a strong export sector, and to do so, the smooth import of intermediate goods is the key, especially at the early stages of export–oriented industrialization.
More than twenty years ago, Myanmar also tried to follow this scenario. Soon after the military took power in 1988, the Myanmar government launched a series of open-door policies. It allowed private firms to engage in external trade, and legitimized border trade with its neighboring countries. As a consequence, Myanmar’s foreign trade increased rapidly during the 1990s and the first decade of the twenty-first century. Its exports grew fifteen times for the period of 1990-2010.
Nevertheless, the value of Myanmar’s exports was by far smaller (less than ten percent), than that of Vietnam in 2010 ( Figure 1 ). While Vietnam exported only 2.5 times more than Myanmar did in 1990, it exported more than 13 times the amount Myanmar did in 2010. Even though the two countries started their open-door policies toward the end of the 1980s, why has such a big gap in export performance been created?
Figure 1: Exports of Myanmar and Vietnam
|
(Source) UN COMTRADE.
|
Diversification of Exports
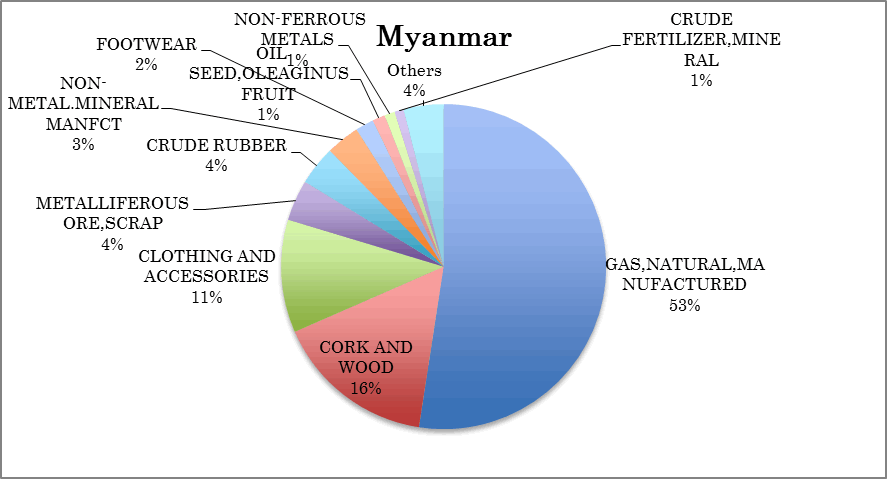
One difference is the degree of diversification of each country’s exports. Figure 2 shows the shares of the top ten exports for Myanmar and Vietnam in 2010. 1 Natural gas accounts for more than half of Myanmar’s exports, which has been exploited off shore from Martaban Bay and transported to Thailand by pipeline since around 2000. Another natural gas field off Rakhine State, called Shwe, is under development, and gas will be exported to Yunnan Province of China by pipeline starting in 2013. Then, the share of natural gas in Myanmar’s total exports will increase even more. Myanmar’s natural gas exports increased from 108.6 million USD in 2000 to 2,595.4 million USD in 2010. Excluding exports of natural gas, Myanmar’s total exports grew by only 6.2% per year from 2000 to 2010. The second largest export item was wood (16%), followed by clothing and accessories (11%). Thus, only three goods accounted for 80% of Myanmar’s total exports in 2010. Clearly, then, Myanmar’s exports have yet to be diversified.
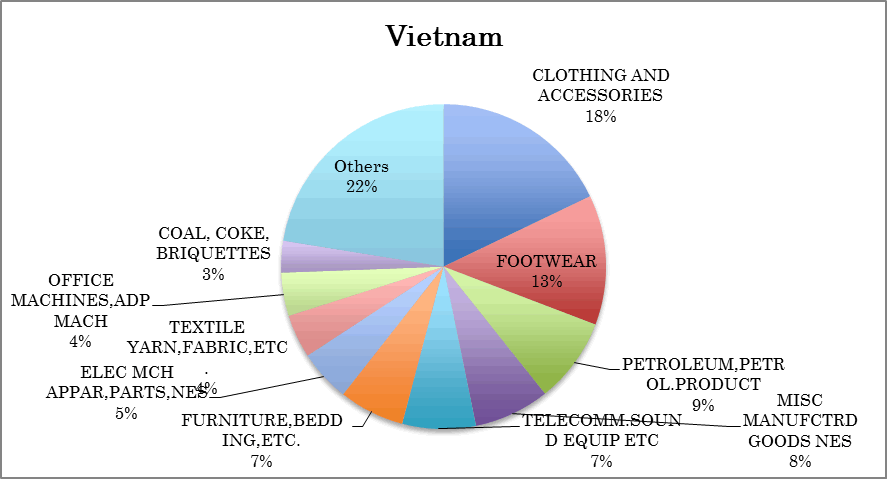
On the contrary, Vietnam’s exports have been more diversified. Clothing and accessories accounted for 18% of total export in 2010, followed by footwear (13%), petroleum (9%), miscellaneous manufactured goods (8%), and telecommunication and sound equipment (7%). The top ten goods accounted for 78% of Vietnam’s total exports. Moreover, the share of petroleum in Vietnam’s exports has declined from 33.4% in 1990 to 19.7% in 2000 and further to 6.0% in 2010.
One difference is the degree of diversification of each country’s exports. Figure 2 shows the shares of the top ten exports for Myanmar and Vietnam in 2010. 1 Natural gas accounts for more than half of Myanmar’s exports, which has been exploited off shore from Martaban Bay and transported to Thailand by pipeline since around 2000. Another natural gas field off Rakhine State, called Shwe, is under development, and gas will be exported to Yunnan Province of China by pipeline starting in 2013. Then, the share of natural gas in Myanmar’s total exports will increase even more. Myanmar’s natural gas exports increased from 108.6 million USD in 2000 to 2,595.4 million USD in 2010. Excluding exports of natural gas, Myanmar’s total exports grew by only 6.2% per year from 2000 to 2010. The second largest export item was wood (16%), followed by clothing and accessories (11%). Thus, only three goods accounted for 80% of Myanmar’s total exports in 2010. Clearly, then, Myanmar’s exports have yet to be diversified.
On the contrary, Vietnam’s exports have been more diversified. Clothing and accessories accounted for 18% of total export in 2010, followed by footwear (13%), petroleum (9%), miscellaneous manufactured goods (8%), and telecommunication and sound equipment (7%). The top ten goods accounted for 78% of Vietnam’s total exports. Moreover, the share of petroleum in Vietnam’s exports has declined from 33.4% in 1990 to 19.7% in 2000 and further to 6.0% in 2010.
Figure 2: Shares of Top 10 Export Goods of Myanmar and Vietnam (2010)
|
|
|
(Source) UN COMTRADE.
|
Export of Manufactured Goods: Apparel and E&E
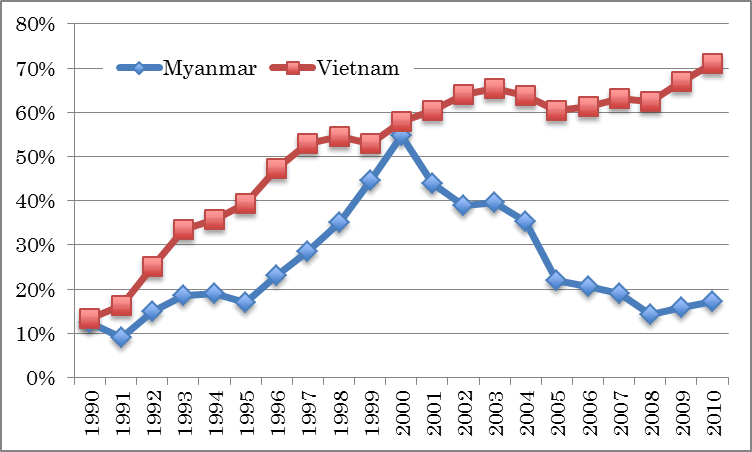
While Myanmar’s exports are still dominated by primary goods, with the exception of apparel (clothing and accessories), Vietnam exports various kinds of manufactured goods. Figure 3 shows the shares of manufactured goods in Myanmar’s and Vietnam’s exports. 2 The export shares of manufactured goods of the two economies were nearly the same at about 12-13% in 1990 and 55-58% in 2000. Since then, Vietnam constantly increased its export share of manufactured goods to 71% in 2010, while the share of Myanmar’s total exports drastically declined to about 20% by 2005.
Clothing and accessories have been the only manufactured export goods in Myanmar. The export share of manufactured goods substantially increased in the last half of 1990s, mainly due to garment exports to the United States (US) and the European Union (EU). However, the US import ban that began in 2003 and the EU’s unwillingness to source made-in Myanmar goods due to human rights issues severely damaged Myanmar’s apparel exports. Myanmar’s apparel exports declined from 0.80 billion USD in 2000 to 0.56 billion USD in 2010. On the contrary, Vietnam continuously expanded its apparel exports, from 1.65 billion USD in 2000 to 11.31 billion USD in 2010, which was 20 times the value of Myanmar’s apparel exports.
Figure 3: Share of Manufactured Goods in Exports (1990-2010)
|
(Source) UN COMTRADE.
|
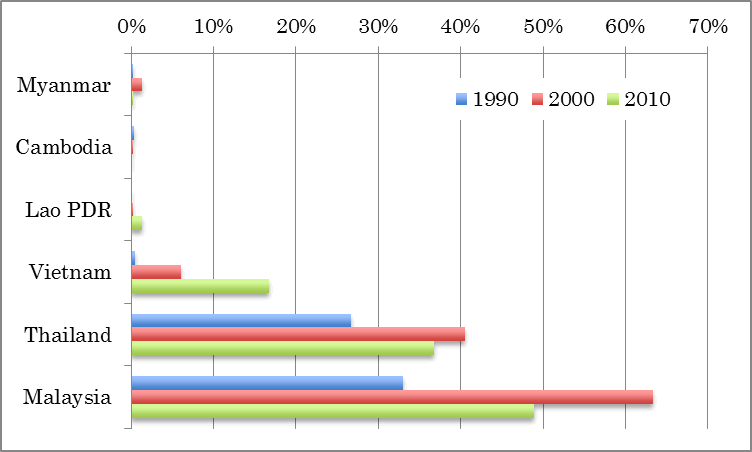
Another category of important export goods is electric and electronic (E&E) products. Historically, E&E products are the main export goods for most of the East Asian countries. Especially after signing of the Plaza Accord on exchange rates in 1985, E&E multi-national enterprises (MNEs) in Japan and Asian NIEs have shifted their production bases to developing ASEAN countries, and production networks have been established in the region. The dependence on E&E exports is a sign of a particular country’s participation in the production networks of East Asia. Figure 4 shows the E&E’ 3 shares of exports for selected ASEAN countries. Thailand and Malaysia seem to be ‘graduating’ from depending on massive E&E exports, and instead Vietnam is increasing E&E exports. Myanmar, Cambodia and Lao PDR seem not yet able to join the E&E production networks in East Asia.
Figure 4: Share of Electric and Electronic Products in Exports
|
(Soure) UN COMTRADE.
|
Joining Production and Distribution Networks in East Asia
As described in Kimura and Obayashi (2011), participation in production networks is an essential part of the novel development strategy in East Asian countries. “These economies aggressively utilize MNEs in an open setting and accept almost all sorts of such firms, which enables them to participate in international production networks and form industrial agglomerations. After this stage, local firms, entrepreneurs, and engineers increase their participation through their penetration into MNEs’ production networks.” (Kimura and Obayasi (ibid), p.1).
Here, we regard the Harmonized System (HS) 2-digit level weighted Grubel-Lloyd (GL) index as a “proxy” of the degree of the participation to East Asian production networks. The GL index is a measure of intra-industry trade of a particular product, defined as
 .
.
It takes 0 if the trade for a particular product is one-direction, i.e., no intra-industry trade. It takes 1 if the trade for a particular product is reciprocal and balanced, i.e., the trade is completely intra-industry. We calculated the GL index for HS 2-digit level and weighted it by the export share of each goods and trade partners, but we limited the trade partners for ASEAN+3 countries. Thus, the index shown in Figure 5 is an intra-regional GL index.
Can a higher GL index be interpreted as a sign of tighter integration into the production networks? If two countries reciprocally export the parts and components of a particular industry, we can assume there is a production network between them. If one country exports the parts and components of a particular industry, while the other country exports the final goods of the same industry, we can assume there is a production network between them. But if two countries reciprocally export the final goods of a particular industry, can we still assume there is a production network between them?
If this was a case examining the EU, the answer might be no. For example, if Germany exports BMW to France and France exports Peugeot to Germany, this is a case of intra-industry trade, but not a production network. If this was a case for East Asia, the answer is likely to be yes, as in East Asia the reciprocal exports of the final goods tend to be intra-firm trade. For instance, Toyota exports pickup trucks from Thailand to other ASEAN countries, while it exports minivans from Indonesia to other ASEAN countries, under the Innovative International Multi-purpose Vehicles (IMV) project. This is a case of intra-industry trade, and also a case of a production network.
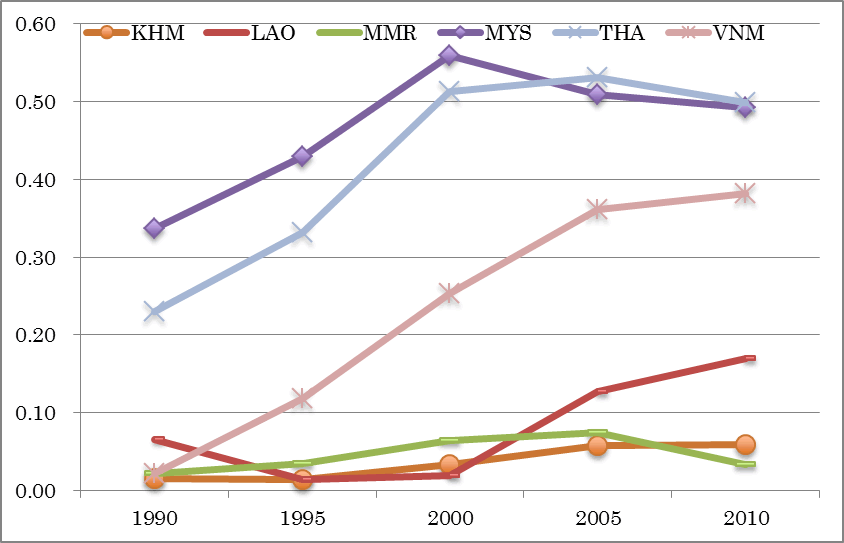
Figure 5 shows the intra-regional GL index for selected ASEAN countries, as mentioned above. We notice that Malaysia and Thailand, two of the advanced ASEAN countries have higher GL indexes, while Cambodia, Lao PDR and Myanmar, the latecomer ASEAN countries, have very low GL indexes. In the case of Vietnam, its GL index increased from 0.02 in 1990 to 0.38 in 2010, showing that Vietnam has been participating in production networks in East Asia during the last two decades.
As described in Kimura and Obayashi (2011), participation in production networks is an essential part of the novel development strategy in East Asian countries. “These economies aggressively utilize MNEs in an open setting and accept almost all sorts of such firms, which enables them to participate in international production networks and form industrial agglomerations. After this stage, local firms, entrepreneurs, and engineers increase their participation through their penetration into MNEs’ production networks.” (Kimura and Obayasi (ibid), p.1).
Here, we regard the Harmonized System (HS) 2-digit level weighted Grubel-Lloyd (GL) index as a “proxy” of the degree of the participation to East Asian production networks. The GL index is a measure of intra-industry trade of a particular product, defined as
.
It takes 0 if the trade for a particular product is one-direction, i.e., no intra-industry trade. It takes 1 if the trade for a particular product is reciprocal and balanced, i.e., the trade is completely intra-industry. We calculated the GL index for HS 2-digit level and weighted it by the export share of each goods and trade partners, but we limited the trade partners for ASEAN+3 countries. Thus, the index shown in Figure 5 is an intra-regional GL index.
Can a higher GL index be interpreted as a sign of tighter integration into the production networks? If two countries reciprocally export the parts and components of a particular industry, we can assume there is a production network between them. If one country exports the parts and components of a particular industry, while the other country exports the final goods of the same industry, we can assume there is a production network between them. But if two countries reciprocally export the final goods of a particular industry, can we still assume there is a production network between them?
If this was a case examining the EU, the answer might be no. For example, if Germany exports BMW to France and France exports Peugeot to Germany, this is a case of intra-industry trade, but not a production network. If this was a case for East Asia, the answer is likely to be yes, as in East Asia the reciprocal exports of the final goods tend to be intra-firm trade. For instance, Toyota exports pickup trucks from Thailand to other ASEAN countries, while it exports minivans from Indonesia to other ASEAN countries, under the Innovative International Multi-purpose Vehicles (IMV) project. This is a case of intra-industry trade, and also a case of a production network.
Figure 5 shows the intra-regional GL index for selected ASEAN countries, as mentioned above. We notice that Malaysia and Thailand, two of the advanced ASEAN countries have higher GL indexes, while Cambodia, Lao PDR and Myanmar, the latecomer ASEAN countries, have very low GL indexes. In the case of Vietnam, its GL index increased from 0.02 in 1990 to 0.38 in 2010, showing that Vietnam has been participating in production networks in East Asia during the last two decades.
Figure 5: Intra-regional Grubel-Lloyd Index for Selected ASEAN countries
|
(Source) Calcurated by authors.
|
Concluding Remarks
For many years, the West has pressured Myanmar in the direction of democracy and respect for human rights by ostracizing its military government through measures such as economic sanctions. Now, the thick fog of military rule that has so far enshrouded the country has become clear. As Western economic sanctions have been eased or lifted, Myanmar’s products will no doubt regain access to global markets, and there will be an influx of foreign investment to this country. The Myanmar economy will become more integrated into the global and regional economies, and have the chance to realize its latent potential.
Myanmar’s exports will accordingly increase, and the export goods and destination shall be diversified. To do so, the first step for Myanmar is to show its ability to host export-oriented industry. The apparel industry seems to serve as a litmus test for this. After that, to be a part of production and distribution networks for E&E industry in East Asia will be a key for Myanmar to proceed to the next stage of industrialization. Myanmar should also tap into intra-regional markets, such as China, India and Thailand, in addition to traditional export markets such as US and EU. Utilizing the regional free trade agreements and further enhancement of the connectivity with these countries is also important for the export-oriented growth strategy for Myanmar.
References
Baldwin, R. E. (2004) “Openness and Growth: What’s the Empirical Relationship?” in Baldwin R. E. and L. A. Winters (eds.) Challenges to Globalization: Analyzing the Economics , University of Chicago Press, pp.499-525.
Kimura, F. and A. Obashi (2011) “Production Networks in East Asia: What We Know So Far”, ADBI Working Paper Series 390.
Rodriguez, F. and D. Rodrik (2001) “Trade Policy and Economic Growth: A skeptic’s Guide to the Cross National Evidence” in Bernanke, B. and K. S. Rogoff (eds.) NBER Macroeconomics Annual 2001 , MIT Press, pp.261-325.
- The Standard International Trade Classification (SITC) 2 digit code is applied. The export values for both Myanmar and Vietnam are the aggregated values of imports of all the reporting countries of UN Comtrade.
- We define the aggregated exports of SITC 5-8 goods as manufactured exports.
- We define the aggregated exports of SITC75-77 goods as E&E exports.
You can download this policy review at the IDE-JETRO website: http://www.ide.go.jp
Contact: Bangkok Research Center, JETRO Bangkok TEL:+66-2253-6441 FAX:+66-2254-1447