IDE Research Columns
Column
The Hidden Poor: How Conventional Poverty Measures Underestimate Child and Female Deprivation in West Africa’s Households

R. Apollinaire NIKIEMA
Institute of Developing Economies, JETRO
July 2025
Accurate identification of individuals in poverty is crucial for designing effective antipoverty programs. Current poverty metrics rely on household-level consumption and the per capita approach, which assumes equal allocation among members. My recent study on eight West African countries recalibrated poverty measures to account for intrahousehold inequality and economies of scale. The analysis reveals two key findings. First, women and children experience significantly higher deprivation levels when intrahousehold inequality is considered. Second, the per capita expenditure approach misclassifies poverty status—underestimating child poverty while overestimating adult poverty. These results argue for integrating intrahousehold inequality into poverty metrics to improve accuracy and policy targeting.
Rethinking Poverty Measurement
Current poverty assessments suffer from a critical blind spot—they assume equal resource distribution within households and ignore economies of scale from shared and joint consumption. While the conventional per-capita approach is operationally convenient, it may systematically misrepresent true deprivation levels when consumption expenses are distributed unequally among household members.
Measuring individual-level deprivation requires consumption data disaggregated at that level. However, most developing countries collect consumption data only at the household level. To address this limitation, economists have developed models that estimate the share of total expenditure allocated to different demographic groups (men, women, and children) and the economies of scale arising from joint consumption (Browning et al. 2013; Calvi et al. 2023; Dunbar et al. 2013).
Expenditure shares reveal within-household consumption inequality. A larger share for one group (e.g., men) compared with another (e.g., women or children) indicates greater consumption by the first group, providing evidence of inequality. Moreover, economies of scale measure the cost savings experienced by individuals as household size increases. This cost saving stems from shared expenses on public or partially public goods, such as housing, utilities, and reduced food waste. By combining estimated expenditure shares and economies of scale, these models reconstruct individual-level consumption, enabling accurate comparisons with the poverty line to identify the truly poor.
Despite this methodological progress, existing research on intrahousehold inequality has largely overlooked the West African context. This gap is particularly concerning because in West Africa, persistent gender disparities in economic opportunities and education coexist with large family structures (World Economic Forum 2024). While gender disparities may lead to unequal resource distribution, large family structures have dual effects—they reduce each member’s share of household resources and create cost-saving opportunities through joint consumption (economies of scale). Drawing on my recent study, this column exposes the influence of consumption inequality and economies of scale on the identification of poor individuals among states in the West African Economic and Monetary Union (WAEMU)i.
Intrahousehold Inequality, Scale Economy, and Individual-Level Deprivation
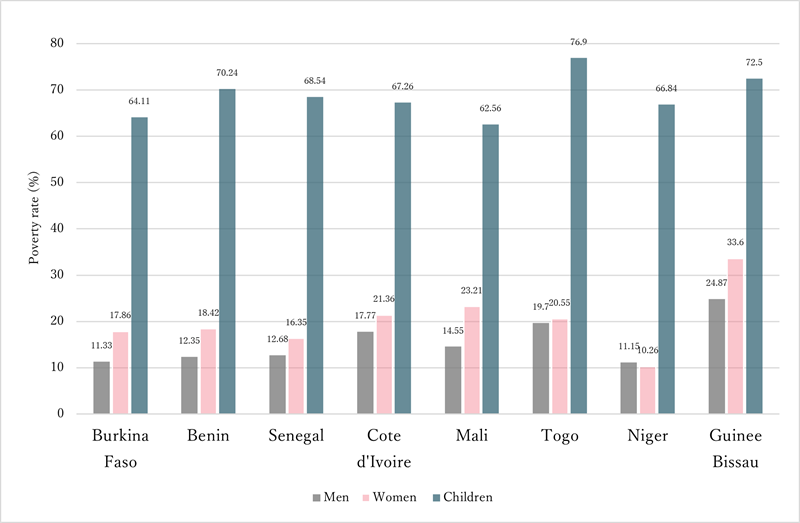
First, my study documented significant gender disparities in resource allocation across WAEMU countries, with men receiving a substantial share of household spending. For instance, men receive 12%–22% more resources than women in countries where inequality is statistically significant. While the estimated shares reveal how household budgets are divided among members, this does not guarantee that everyone’s needs are met or that the distribution is equitable. Additionally, spending patterns vary by household size because larger families have different compositions (e.g., the number of children) than smaller ones. Therefore, I evaluated the implications of intrahousehold resource distribution for individual-level deprivation. The findings revealed that, on average, women and children experience significantly higher poverty rates when intrahousehold inequality is considered. More specifically, women are 4.65 percentage points more likely to be poor than men, with the largest gender gap (8.73 percentage points) observed in Guinea-Bissau (Figure 1).

Figure 1. Individual Poverty Rates among WAEMU Countries
Source: Constructed based on Table 3 in Nikiema (2025)
Second, my study revealed significant economies of scale in WAEMU households, demonstrating that larger households incur substantially lower per capita living costs compared with smaller households. For instance, men in larger households—those other than one-child monogamous households—require only 66%–71% of the expenditure requirement of men in one-child monogamous households to maintain an equivalent living standard. Children benefit the most from these scale effects because of their prevalence in household composition and shared resources, such as housing and clothing. Additionally, the study demonstrated that adjusting for economies of scale substantially reduces poverty rates by 60% for adults and 30% for children and narrows the gender poverty gap to 3.36 percentage points. However, larger households are associated with a higher incidence of poverty, particularly among children, as economies of scale fail to fully compensate for their lower per capita resource shares.
Ignoring Consumption Inequality and the Scaling Effect Misclassifies Poverty Status
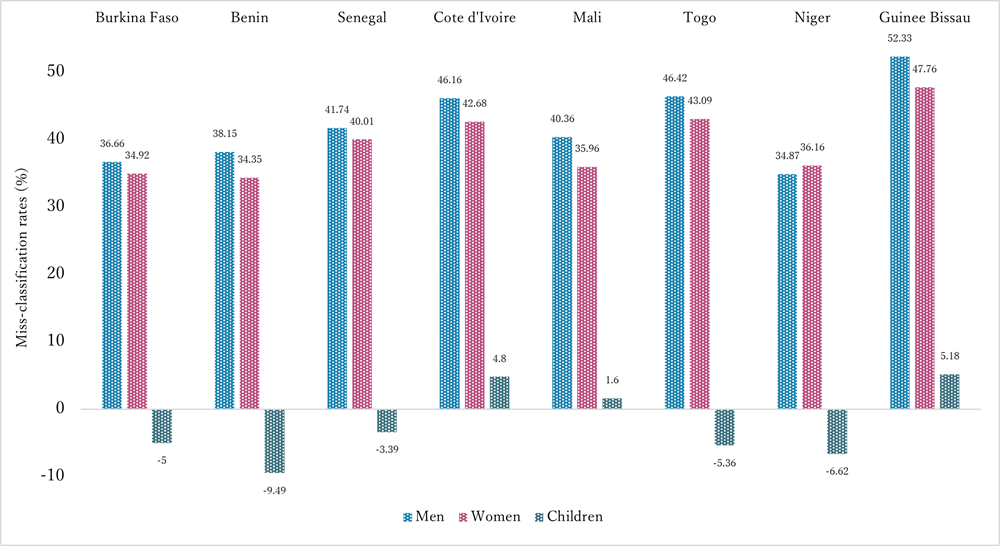
Figure 2 depicts the extent to which conventional poverty metrics misclassify individual poverty status relative to intrahousehold consumption inequality-adjusted poverty measures. The per capita approach systematically overestimates adult poverty (misclassifying 34%–53% of poor men and 34%–48% of women as poor) in all the eight states. Regarding child poverty, Figure 2 reveals that poverty status is underestimated in five countries (with 3%–10% of children misclassified as non-poor), while overestimation occurs only in three nations—Côte d’Ivoire, Mali, and Guinea-Bissau. However, my study demonstrated that when economies of scale are accounted for, the per capita approach systematically underestimates child poverty across all WAEMU countries. This misclassification is particularly pronounced among children in large households—whose deprivation is consistently overlooked in conventional poverty assessments. In summary, these patterns underscore the inability of traditional metrics to accurately identify poor individuals in households.

Figure 2. Poverty Miss-classification Rates
Notes: Positive bars indicate net overestimation of poverty, while negative bars represent net underestimation.
Source: Constructed based on columns (1) and (3) of Table 4 in Nikiema (2025)
Policy Implications
The findings reveal the need for a fundamental redesign of poverty alleviation strategies across WAEMU nations, shifting from household-level approaches to targeted interventions addressing unequal resource allocation for women and children. Additionally, it may be beneficial to revise national poverty metrics to account for intrahousehold inequality and economies of scale. Such adjustments can help provide a more accurate picture of child poverty in larger households and adult deprivation levels. Practical implementation would require national statistical agencies to collect disaggregated individual-level consumption data, disaggregated by women, men, girls and boys —a critical step toward accurate measurement and effective, equitable policy design.
Authors’ Note
The main research on which this column is based is: Nikiema, R. A. 2025. “Intrahousehold Inequality, Economies of Scale, and Poverty: Evidence from Eight Harmonised Living Standard Measurement Surveys Data in West Africa.” Journal of Development Studies April: 1-26. https://doi.org/10.1080/00220388.2025.2487006.
Note
- Nikiema (2025) used data from the “Enquête Harmonisée sur les Conditions de Vie des Menages” (EHCVM 2018/19). The data were obtained from the World Bank Microdata Library.
References
Browning, M., Chiappori, P. A., & Lewbel, A. 2013. “Estimating Consumption Economies of Scale, Adult Equivalence Scales, and Household Bargaining Power.” Review of Economic Studies 80(4): 1267–1303. https://doi.org/10.1093/restud/rdt019
Calvi, R., Penglase, J., Tommasi, D., & Wolf, A. 2023. “The More the Poorer? Resource Sharing and Scale Economies in Large Families.” Journal of Development Economics 160. https://doi.org/10.1016/j.jdeveco.2022.102986
Dunbar, G. R., Lewbel, A., & Pendakur, K. (2013). “Children’s Resources in Collective Households: Identification, Estimation, and an Application to Child Poverty in Malawi.” American Economic Review 103(1): 438–471. https://doi.org/10.1257/aer.103.1.438
World Economic Forum. 2024. Global Gender Gap 2024. https://www.weforum.org/publications/global-gender-gap-report-2024/
Author’s Profile
R. Apollinaire NIKIEMA is a Research Fellow at Institute of Developing Economies, Japan External Trade Organization (IDE-JETRO). He acquired a Ph.D. degree in Agricultural Economics from the University of Tokyo in 2021. His research interests include agricultural markets, food security, and intrahousehold bargaining in Sub-Sahara Africa. Before joining IDE-JETRO, He served as Postdoc at the University of Tokyo and a Monitoring and Evaluation Specialist for the Center for Evaluation and Development (C4ED).
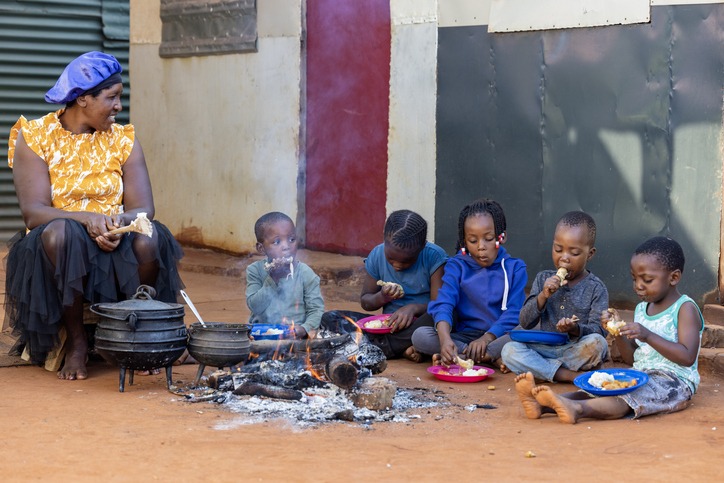
* Thumbnail image: Children sitting around a fire eating corn/maize and chicken (Martin Harvey / Getty Images)
**The views expressed in the columns are those of the author(s) and do not represent the views of IDE or the institutions to which the authors are attached.
This column is licensed under a Creative Commons Attribution 4.0 International license (CC BY 4.0). https://creativecommons.org/licenses/by/4.0/deed


