IDE Research Columns
Column
Supply Chain Exposure to Geographic Concentration Risk: In View of Engagement Frequency


Satoshi INOMATA
June 2024
Institute of Developing Economies, JETRO
We present new reference statistics for the degree of supply chain’s exposure to geographic concentration risk. The study’s net contribution is developing a metric that indicates network concentration in terms of the frequency of supply chain engagement with regions of analytical interest, in addition to the traditional approach of measuring value-added concentration by volume.
The traditional input–output analyses are largely based on the volume concept, such as the trade in value-added indicator, whereas the current model explores a novel dimension of “frequency” in this analytical space.
With the rise of global value chains, production networks continued to expand to cover the entire globe; however, the pursuit of optimal resource allocation frequently resulted in the agglomeration and concentration of key production capacities in a specific region of a given country.
This may work well in good times, but when things go wrong, these production hubs can quickly become “choke points” for the entire economic system. Several examples can be found in recent history, such as the Lehman Shock, the Great East Japan Earthquake, and various types of cyber-attacks, where hyper-economic interdependence made the production and financial systems particularly vulnerable to a single point of failure.
A Combined Analysis: Volume Versus Frequency
There are two dimensions to risk analysis: volume and frequency. For example, our families are more likely to become infected with a virus if they visit a risky place together or if a family member, even if just one, visits such a location frequently. Alternatively, a more straightforward analogy would be that earthquakes are reported and analyzed in terms of both magnitude and frequency of occurrence.
In our context, a supply chain is considered highly exposed to a specific country risk:
- if its product contains significant value-added volume from that country; or
- if production activities along the supply chain involve frequent engagement with the country’s industrial sectors.
In what follows, the former is measured using conventional trade in value-added (TiVA) indicators, whereas the latter is captured by a new indicator called pass-through frequency (PTF). Both of them are derived from the intercountry input–output table, a popular tool to show the structure of global production networks. Combining these two indicators allows us to present supply chains’ exposure to concentration risk in both volume and frequency dimensions.
Let us begin with concentration risk in terms of volume. TiVA considers each country’s contribution to the value-adding processes of a specific commodity. Thus, from the perspective of final product producers, the TiVA indicator shows how much value their products are attributable to the value-added origin of each country, demonstrating the ultimate form of supply chain dependence in volume terms.
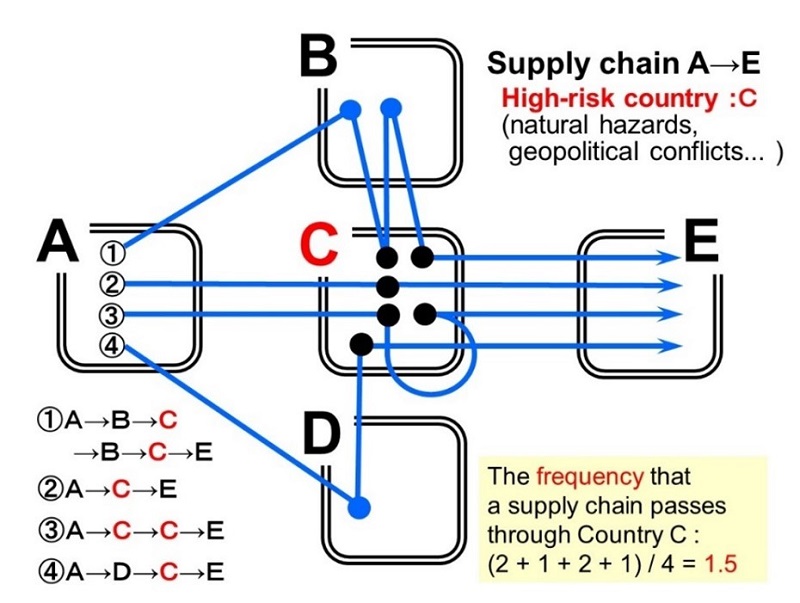
Next, we consider network concentration in terms of frequency. From a risk analysis standpoint, if a supply chain has multiple production paths that pass-through the industries of a high-risk country (whatever that term means), its vulnerability is considered higher. For example, in Figure 1, let Country C be the high-risk country, and assume that the supply chain connecting Countries A and E has four production paths via Country C. The first path passes through Country C twice, the second path once, the third path twice, and the fourth path once, resulting in an average supply chain pass-through of Country C to be 1.5, compared to only 0.5 for Country B and 0.25 for Country D.
Of course, this is only an example; in the real world, supply chains have infinite production paths, and it is impossible to examine each one individually. Instead, we will calculate the PTF using an intercountry input–output table. PTF is defined as the average number of times a supplier of analytical concern appears along production paths; in our context, it effectively measures the frequency with which a supply chain passes through a high-risk country’s industrial sectors.

Figure 1. A Supply Chain Passing Through a High-Risk Country: An Illustrative Example
Source: Drawn by the author.
Analytical Example
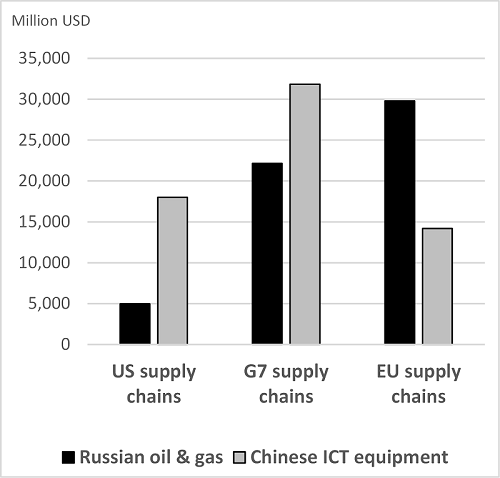
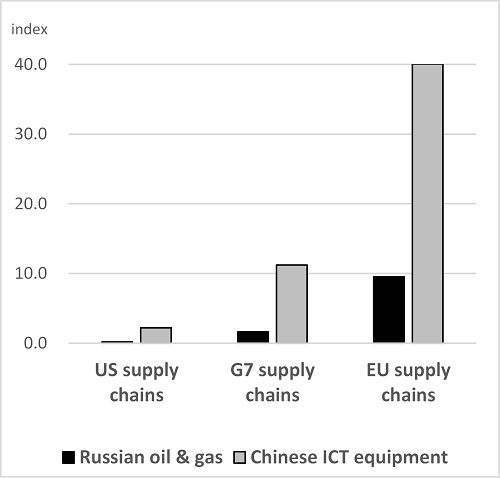
Figure 2 compares the US, G7, and EU supply chain exposure for volume and frequency measurement to the “Russian oil and gas” and “Chinese ICT equipment” sectors.
For the volume-based measurement in the left panel, the level and nature of value source concentration vary by country group: the US supply chain concentration is more visible for sources in the Chinese ICT sector than for sources in Russian oil and gas, but the opposite is true for EU supply chains, which show high energy dependency on Russia. By contrast, for the frequency-based measurement in the right panel, all country groups show an acute concentration in the Chinese ICT sector, whereas the concentration in Russian oil and gas is marginal.
The diagram clearly shows that the level and nature of concentration risks vary depending on the type of product under consideration, possibly due to differences in supply chain complexity and the production position of industries along supply chains.

Volume-Based Concentration
(Share of value-added sources)

Frequency-Based Concentration
(PTF)
Figure 2. Concentration Risk Analysis at the Sectoral Level (2020)
Source: Drawn by the author.
Why Does Frequency Matter After All?
So, why is frequency important? Here, we focus on one particular example of high policy relevance in the geoeconomic context.
Let us consider the US export control measures for advanced technologies and strategic materials. One of the policy’s characteristics is the extensive implementation of “extra-territorial application” of the US rules, which require a foreign establishment (whether US or non-US) to obtain a license from the relevant US authorities when trading a controlled item with the country of “the US security concern.”
In general, a license is required for any planned transaction, regardless of size (with some exceptions for extremely small values). Hence, from the perspective of a global firm, the frequency of engagement with the country of concern, both of its own and upstream suppliers, is critical for supply chain management.
Not to mention the time foregone and administrative costs incurred during the US authority’s review process, the firm may have to revise its entire production plan if the license is not granted. The cross-border PTF can address this type of risk at the country level (rather than the sectoral level as shown in Figure 2), which measures the frequency with which a supply chain crosses the national borders of a specific country, netting out any domestic flows of goods and services. Such a risk is particularly evident in industries like the ICT equipment sector, which has a highly complex nexus of cross-border transactions, even if each batch’s volume is small.
Authors’ Note
This column is based on Inomata, Satoshi, and Tesshu Hanaka. 2024. “Measuring Exposure to Network Concentration Risk in Global Supply Chains: Volume versus Frequency.” Structural Change and Economic Dynamics: 68: 177–93. https://www.sciencedirect.com/science/article/pii/S0954349X23001339
* Thumbnail image: Eurogate Hamburg 4 (mybroetchen, CC-BY 2.0, via Wikimedia Commons)
** The views expressed in the columns are those of the author(s) and do not represent the views of IDE-JETRO or the institutions with which the authors are affiliated.

