IDE Research Columns
Column
Does a Healthy Diet Help in Environmental Sustainability? A Case Study of Chinese Dietary Guidelines

Lei LEI
Institute of Developing Economies, JETRO
November 2023
Since 2015, the Chinese government has actively promoted the Chinese Dietary Guidelines (CDGs), which target public health and sustainable food consumption and production. This research column shows that Chinese people’s dietary patterns still deviate from the CDGs. It also explores how reducing these deviations will influence environmental sustainability. Finally, it investigates the key driving factors behind the deviations. The results show that reducing deviations will positively affect the overall diet quality. However, the impact on environmental sustainability is complex. How to improve environmental costs should be discussed.
Chinese Dietary Patterns
Given its rapid economic development, China’s dietary patterns are drastically changing from traditional diets to energy-dense foods that are high in saturated fat and low in carbohydrates. Dietary change is often considered a key driving force behind the recent increase in obesity and diet-related chronic diseases in China. Meanwhile, dietary change may also influence environmental outcomes by changing agricultural production, which often generates substantial environmental burdens.
The health and environmental effects of dietary changes have been addressed in the Chinese Dietary Guidelines (CDGs) since 1989, which aimed to guide individuals and policymakers in achieving healthy and sustainable food consumption and production. In 2015, the Chinese government began actively promoting CDGs to increase public awareness (The State Council Information Office of the People’s Republic of China 2015). However, although the health outcomes of CDGs are emphasized, environmental aspects have rarely been mentioned.
Overview of the Chinese Dietary Guidelines
The Chinese Nutrition Society has published numerous versions of the CDGs, incorporating changes in nutritional status and food consumption patterns in China. CDGs recommend the consumption amount of the nine major food groups for the general population based on their energy requirements. For example, in the 2007 CDGs, it was suggested that a healthy adult aged 18–59 years old whose required energy level is 2000 kcal (8350 kJ) should consume 300-g cereals, 40-g soybeans, 350-g vegetables, 30-g fruits, 50-g meat, 300-g dairy, 25-g eggs, 75-g seafood, 25-g cooking oil, and 6-g salt daily (Chinese Nutrition Society 2007).
In the past 30 years, the CDG format has become simpler and thus easier for public promotion. Regarding sustainability targets, the CDGs have mainly focused on health aspects, with suggestions focused on food consumption and health. Given the current prevailing situation, CDGs may have had a limited effect on agricultural production and the market.
Deviations between Dietary Patterns and CDG Recommendations
To clarify how the Chinese still deviate from the recommendations of the CDGs in terms of their diets, the China Health and Nutrition Survey (CHNS) between 1991 and 2011 was used. The most granular classification of nine energy levels from the 2007 CDGs was followed, and the focus was on the energy levels between 1600 and 2800 kcal.
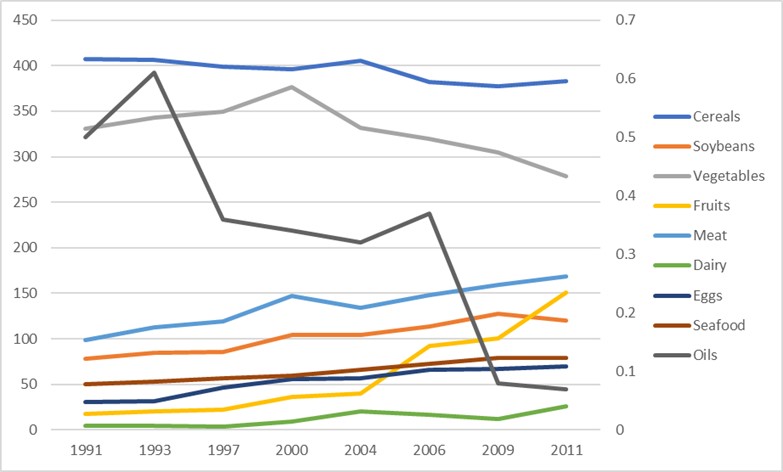
Figure 1 presents the average daily consumption of nine food groups per person between 1991 and 2011. Among the nine food groups, cereal, vegetables, and oils (scales on the left-hand side) showed a decreasing trend over the study period. However, soybean, fruit, seafood, meat, and dairy consumption has steadily increased. These positive changes (except for meat and vegetables) follow the 2007 CDGs. Particularly, fruit and egg consumption showed substantial improvement: fruit consumption increased eight times, whereas egg consumption more than doubled. In contrast, meat and vegetable consumption increasingly deviated from the CDGs’ recommended ranges.

Figure 1. Mean Consumption (in gram) of the 9 Food Groups in the General Population
(Healthy Adults Aged 18–59 Years Old).
Source: Based on Lei and Shimokawa (2020).
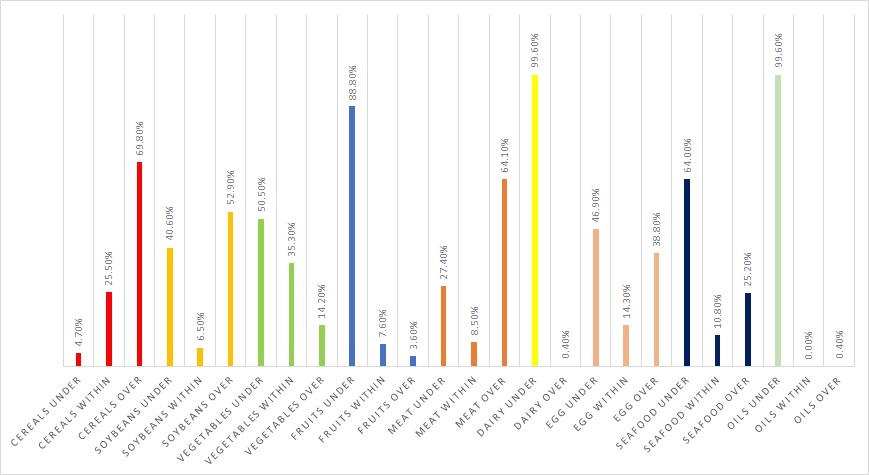
How many people consume food below, within, or above the CDGs’ recommended range for the nine food groups? Figure 2 describes the average proportions of these individuals throughout 1991, 2000, and 2011. It shows substantial dietary problems in vegetable, fruit, meat, dairy product, egg, and seafood consumption. First, 64% of people overconsumed throughout the study period. However, an increasing number of people under-consumed vegetables. Second, although fruit consumption showed substantial improvement over time, on average, 89% of people still under-consumed fruits. Third, dairy products and seafood were also under-consumed by most people. Lastly, egg consumption shifted from under-consumption to over-consumption during the period, but on average, more people under-consumed eggs at 47%. Additionally, the proportion of people who satisfied the CDGs’ recommended range remained almost the same at 14% on average.

Figure 2. Average Proportions of People Consume Under, Within, and Over the CDG’s Recommended Range
for 9 Food Groups.
Source: Based on Lei and Shimokawa (2020).
Environmental Impact of Promoting CDGs
If people change their diets following CDGs’ recommendations, how will it affect the environment through agricultural production? To measure environmental burdens due to agricultural production and consumption, emphasis was placed on Greenhouse gas GHG emissions, energy use, and blue water footprint1. These measures are selected because they are relatively common for various food products, and they receive more attention from different stakeholders, such as researchers, policymakers, and the public (Eshel and Martin 2006; Mekonnen and Hoekstra 2011).
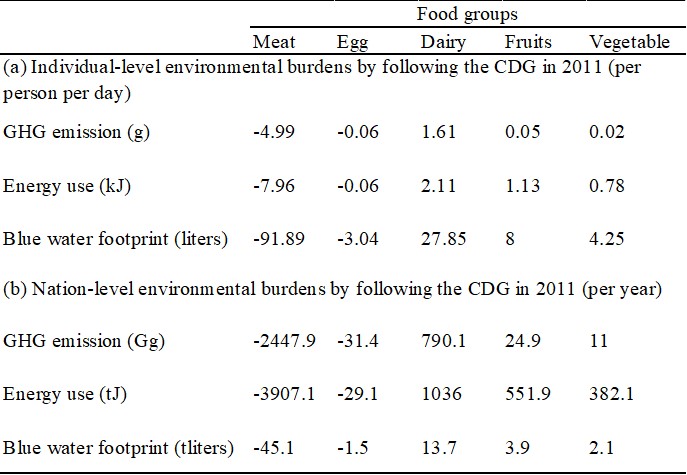
Figures 1 and 2 present five food groups that show particularly problematic deviations from the CDGs’ recommended diets (i.e., meat, egg, dairy, fruits, and vegetables). Table 1 summarizes our estimates of possible environmental costs if people’s average diets of those food groups are adjusted to the 2011 CDG recommendations. Panel (a) presents the environmental influences per person daily per food group, and panel (b) presents the nation-level environmental influences in China annually.
Table 1 highlights three points: 1) reducing meat and egg consumption will be strongly justified by improving diet quality and environmental sustainability; 2) increasing fruit and vegetable consumption can be justified by balancing between diet quality and environmental costs; and 3) increasing dairy consumption may be least justifiable considering its substantial environmental costs, and it becomes vital to reduce those costs.
Table 1. Environmental Impacts of Adjusting People’s Average Diets to the Dietary Guidelines’ Diets in China
in 2011.

Notes: Panels (a) and (b) are authors' estimations based on Heller and Keoleian (2015) and Tom et al. (2016)'s estimates. kJ is kilojoule = 103D; tJ is terajoule = 1012J; tliter is teraliters = 1012l; Gg is gigagram = 109g = 1000 t. Blue water footprint “refers to the volume of freshwater taken from the surface or ground to create a product, and which has then evaporated, been incorporated into the product, or been returned to a separate catchment from which it was originally withdrawn” (Michelle, Fischbeck, and Hendrickson 2016).
Source: Lei and Shimokawa (2020).
Simultaneously, despite the different implications across food groups, the overall environmental burdens in China would decrease by adjusting people’s diets to those of the CDGs. Therefore, CDGs promotion may generally improve diet quality and environmental sustainability in China. Noteworthy, the decrease in environmental burdens significantly depends on reducing meat consumption. Alternatively, without reduced meat consumption, CDG promotion may simply increase environmental burdens. To avoid this, further agricultural production, management, and transportation improvements are necessary.
Conclusion
In additional analyses, the key driving socioeconomic factors behind the deviations from the recommended diet of CDGs were also examined. It was found that increasing urbanization and income are the most effective, with urbanization being more effective. In addition, lower cereal and fruit prices would reduce meat consumption and increase fruit consumption. Unexpectedly, there is no positive effect of better dietary knowledge and higher meat prices for reducing the deviations.
Our findings imply that reducing meat consumption is particularly important for CDGs because of its dominant and beneficial effects on health and the environment. In addition, reducing cereal and fruit prices may help in achieving the CDGs’ targets through reduced meat consumption and increased fruit consumption, which helps in achieving the health and environmental targets.
Simultaneously, increasing agricultural production (especially dairy products) inevitably increases environmental burdens. Thus, when the CDGs recommend more dairy, fruit, and vegetable consumption, it is also essential to discuss how to manage the environmental burdens, including advancing production technology, efficient management strategy, and public policy.
Author’s Note:
This column is based on Lei, Lei, and Satoru Shimokawa. 2020. “Promoting Dietary Guidelines and Environmental Sustainability in China.” China Economic Review 59: 101087. https://doi.org/10.1016/j.chieco.2017.08.001
Note:
- Blue water footprint refers to “the volume of freshwater taken from the surface or ground to create a product, and which has then evaporated, been incorporated into the product, or been returned to a separate catchment from which it was originally withdrawn” (Michelle, Fischbeck, and Hendrickson 2016).
References
Chinese Nutrition Society. 2007. “Chinese Dietary Guidelines 2007.” [In Chinese.] http://dg.cnsoc.org/article/2007b.html.
Eshel, Gidon, and Pamela A. Martin. 2006. “Diet, Energy, and Global Warming.” Earth Interactions 10 (9): 1–17.
Heller, Martin C., and Gregory A. Keoleian. 2015. “Greenhouse Gas Emission Estimates of US Dietary Choices and Food Loss.” Journal of Industrial Ecology 19 (3): 391–401.
Mekonnen, Mesfin M., and Arjen Y. Hoekstra. 2011. “The Green, Blue and Grey Water Footprint of Crops and Derived Crop Products.” Hydrology and Earth System Sciences 15 (5): 1577–1600.
Tom, Michelle S., Paul S. Fischbeck, and Chris T. Hendrickson. 2016. “Energy Use, Blue Water Footprint, and Greenhouse Gas Emissions for Current Food Consumption Patterns and Dietary Recommendations in the US.” Environment Systems and Decisions 36: 92–103.
The State Council Information Office of the People's Republic of China. 2015. 卫生计生委等介绍《中国居民营养与慢性病状况报告(2015)》有关情况. [In Chinese.] Updated on June 30, 2015. https://www.gov.cn/xinwen/2015-06/30/content_2887030.htm
* The views expressed in the columns are those of the author(s) and do not represent the views of IDE or the institutions with which the authors are affiliated.
** Thumbnail image: Vegetables sold in the market (wang mengmeng / Moment / Getty Images)

