

IDE Research Columns
Column
Making Global Value Chains Visible: A Smile Curve Analysis of the US–China Trade Conflicts

Bo MENG
March 2022
The Institute of Developing Economies, JETRO
We develop a visualization method based on the smile curve concept to provide reader-friendly presentations of global value chains (GVCs) analyses. Our method combines “trade in value-added” and “value-added propagation length” measures, thus helping in the identification of value-added gains, positions, and interdependencies of all GVC participants along the upstream and downstream of a smile curve. Applying this method to the exporting activities of domestic- and foreign-owned ICT firms in the US and China reveals how “sticky” the interdependency between the US and China is and the potential impacts of the US–China trade conflicts on other GVC participants along smile curves.
Introduction
Given the rapid development of GVCs over the past three decades, the “made in” label, which is typical of manufactured goods, attributing them to a specific economy, has become an archaic symbol of a bygone era, as most manufactured goods are now “Made in the World” (Antràs and Chor 2021). The rise of GVCs, which is accompanied by a substantial improvement in the economic efficiency of multinationals, has significantly changed the nature and structure of international trade (WTO 2019), as well as the topology of interdependency and influencing powers of countries (Xiao et al. 2020).
As a response to providing better measures of GVCs, several indicators based on inter-country input–output (ICIO) models have been developed. They mainly include trade in value-added (Johnson and Noguera 2012), decomposition of gross exports in value-added terms (Koopman, Wang, and Wei 2014), as well as GVC participation, position, and length indices (Antràs et al. 2012, Wang et al. 2017). Those indicators can be presented individually at the country, sector, and bilateral levels (Asian Development Bank et al. 2021), but without proper combination and design, they are difficult to be used to present an entire storyline for a specific GVC phenomenon. More importantly, most of their applications are based on the conventional ICIO data, which only provides country-sector rather than firm ownership-oriented explanations for GVCs. However, the reality of GVCs is that “multinationals account for roughly one-half of international trade, one-third of output and GDP, and one-fourth of employment in the global economy” (Cadestin et al. 2019). Therefore, without explicit consideration of the role of multinational enterprises in GVCs, the explanatory power of existing GVC indicators will be largely limited.
To provide a reader-friendly presentation on the nature and structure of complexly evolved GVCs with explicit consideration of firm heterogeneity, we develop a new visualization method—the smile curve analytical tool—and apply it to the policy discussion of the US–China trade conflicts based on the OECD’s new ICIO data, in which sectors are split according to firm ownership (Cadestin, et al. 2018).
The smile curve concept
Shih (1996)i observed that in the personal computer industry, both ends of the value chain command higher value-added to the product than the middle part of the value chain. If this phenomenon is presented in a graph with value-added represented on the Y-axis and the value chain stages represented on the X-axis, the resulting curve appears like the shape of a smile. Borrowing this idea, Meng, Ye and Wei (2020) and Meng and Ye (2022) provided the pioneering methods to identify smile curves in GVCs using ICIO data. The originality and innovation of their works are that they consistently combined the “trade in value-added” concept to measure value-added gains and the “value-added propagation length” to measure the positions of countries, sectors, and firms along the upstream and downstream of a conceptual GVC.
Mapping smile curves in GVCs
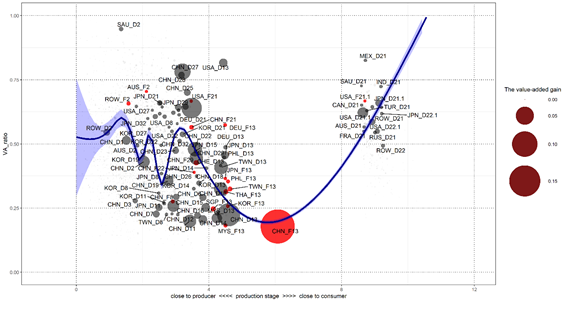
To give a better mapping of GVC using smile curves, the most popular and simple approach is to focus on the export of a specific final good produced by a specific type of firm and to consider how value is added from one country, sector, and firm to another country, sector, and firm throughout the entirety of the value chain, as well as considering how the product is ultimately consumed. As depicted in Figure 1, we can use China-based domestic-owned firms’ ICT exports to the world market as a starting point to divide the whole value chain into upstream and downstream stages.

Figure 1. China-based domestic-owned ICT firms’ value chain (2016)
Note: D and F represent domestic- and foreign-owned firms, respectively; country-sector
codes are available at https://www.oecd.org/sti/ind/analytical-amne-database.html
Source: the OECD AMNE Data
The X-axis denotes the position measured by the value-added propagation length between global consumers of ICT products and a specific participating firm, and the Y-axis denotes the value-added ratio (value-added gained by producing a unit US$ of output). The size of the circle denotes the absolute value-added gain of GVC participants, and the smooth line with shadowed area fitted by local polynomial regression represents the confidence interval of the mapping.
Empirical results about ICT firms’ value chains
With China-based ICT firms’ exporting activities in 2016 as the analytical target, Figures 1 and 2 depict that the corresponding value chains, whether they are organized by China-based domestic-owned ICT firms (CHN_D13) or foreign-owned ICT firms (CHN_F13), appear as “smile curves,” where the ICT-exporting firms take the largest portion of value-added gain but only obtain very low value-added per unit of exports. Thus, they are located at the low-end of these curves.

Figure 2. China-based foreign-owned ICT firms’ value chain (2016)
Note: D and F represent domestic- and foreign-owned firms, respectively; country-sector
codes are available at https://www.oecd.org/sti/ind/analytical-amne-database.html
Source: the OECD AMNE Data
Similar to the findings from the case study on iPhone’s supply chain, this result is more evident for China-based foreign-owned ICT firms (Xing and Detert 2010). The value chain, as it relates to the US-based domestic-owned ICT firms’ exports (Figure 3), has an inverted U-shaped smile curve, in which the US-based domestic-owned ICT firms (USA_D13) take the major share of the value-added gain, with very high value-added ratio and less usage of intermediate inputs provided by other types of firms, both domestically and internationally.

Figure 3. The US-based domestic-owned ICT firms’ value chain (2016)
Note: D and F represent domestic- and foreign-owned firms respectively; country-sector
codes are available at https://www.oecd.org/sti/ind/analytical-amne-database.html
Source: the OECD AMNE Data
This result reflects the higher technology upgrading and specialization of the US-based domestic-owned ICT firms, which can create more value-added per unit of output, relying on more domestic, high-skilled labor and sophisticated capital.
The value chain of the US-based foreign-owned ICT firms’ (USA_F13) exports (Figure 4) also appear as a “smile curve,” implying that foreign-owned firms can still find opportunities in the US to arrange value chains, as is done in China. They can do this partly because the US economy is big enough with large differentials of primary costs across states, as well as the ease of importing cheaper intermediate goods with lower import tariff rates from the world market.

Figure 4. The US-based foreign-owned ICT firms’ value chain (2016)
Note: D and F represent domestic- and foreign-owned firms, respectively; country-sector
codes are available at https://www.oecd.org/sti/ind/analytical-amne-database.html
Source: the OECD AMNE Data
Our results also reveal that more China-based domestic-owned firms, including both manufacturing and services suppliers (e.g., CHN_D27: financial firms), have been increasingly involved at the upstream stage of almost all the smile curves identified. This reflects the quick industrial upgrading happening in China, which has enabled more China-based domestic-owned firms to replace other suppliers in GVCs.
Policy discussion
Based on the above findings, the relationship between the US and China in ICT value chains and the interdependency of all other value chain participants in the upstream and downstream have been identified. This can help us discuss several important policy implications of the recent trade conflicts between the US and China. First, GVCs can play an essential role as an automatic stabilizer of trade conflicts. This is mainly because the development of GVCs is an irreversible process of the ongoing globalization and is mainly based on each country’s comparative advantages, which are dominated by firms rather than governments. Thus, economic efficiency could be guaranteed in the long run. Any exogenous nonmarket shock might tentatively impact GVCs but cannot change the fact that GVCs do follow market mechanisms.
Second, the context of the US–China trade conflicts is totally different from those of previous the US–Japan trade conflicts. For example, the US and Japan were competitors in exporting cars during 1970–1980, but the US and China are both competitors and collaborators in producing smartphones under a sticky interdependency in the era of GVCs. Without the existence of a competition–collaboration dynamic, we cannot imagine how such high-quality and cheap smartphones can be made (or assembled) in China and exported all over the world, bringing substantial benefits to our lives. Moreover, without the existence of a competition–collaboration dynamic, it would be difficult for the massive investment in R&D for innovation in the US to be paid off.
Third, as both competitors and collaborators along almost all ICT value chains, the “Paradoxical Pair of Concerns”ii has been widely recognized by both the US and China. China would not want to be locked in at the low-end of the GVCs (tangible activities) led by multinationals and would likely adopt very ambitious (somehow radical) innovation strategies to support their firms to engage in more intangible activities (Cheng et al. 2020). Therefore, more China-based domestic-owned firms, especially high value-added services suppliers have been able to climb up the ladder to the high end and have directly and indirectly enjoyed more value-added gains in the upstream of GVCs. Thus, the quickly increasing presence of Chinese firms in GVCs might be another possible reason for the US–China trade conflicts. The nature of the current the US–China trade conflicts may be similar to the following views from international politics literature: “relative gains are more important than absolute gains” (Waltz 1959, p198); “the first concern of states is not to maximize power but to maintain their position in the system” (Waltz 1979, p126).
Acknowledgement
The author thanks Dr. Ming Ye (Nanjin Univeirty, China) for helping compile the simle curve figures used in this paper.
References
Asian Development Bank, Research Institute for Global Value Chains at the University of International Business and Economics, the World Trade Organization, Institute of Developing Economies, and the China Development Research Foundation. 2021. Global Value Chain Development Report 2021: Beyond Production. Asian Development Bank.
Antràs, Pol, and Davin Chor. 2021. “Global value chains.” NBER Working Paper 28549.
Antràs, Pol, Davin Chor, Thibault Fally, and Russel Hillberry. 2012. “Measuring the Upstreamness of Production and Trade Flows.” American Economic Review 102(3): 412-16.
Baldwin, Richard, Tadashi Ito, and Hitoshi Sato. 2014. “The Smile Curve: Evolving Sources of Value Added in Manufacturing.” Joint Research Program Series, Tokyo: IDE-JETRO.
Cadestin, Cadestin, Koen De Backer, Isabelle Desnoyers-James, Sébastien Miroudot, Davide Rigo, and Ming Ye. 2018. “Multinational Enterprises and Global Value Chains: The OECD Analytical AMNE Database.” OECD Trade Policy Papers 211.
Cadestin, Cadestin, Koen De Backer, Sébastien Miroudot, Laurent Moussiegt, Davide Rigo, and Ming Ye. 2019. “Multinational Enterprises in Domestic Value Chains” OECD Science, Technology and Industry Policy Papers 63.
Cheng, Wenyin, Bo Meng, and Yuning Gao. 2020. “China’s Innovation Boom: Miracle or Mirage?” IDE Discussion Paper 777.
Johnson, Robert C. and Guillermo Noguera. 2012. “Accounting for Intermediates: Production Sharing and Trade in Value-added.” Journal of International Economics 86(2): 224–236.
Koopman, Robert, Zhi Wang, and Shang-Jin Wei. 2014. “Tracing Value-added and Double Counting in Gross Exports.” American Economic Review 104(2): 459-¬¬¬–94.
Meng, Bo, Ming Ye, and Shang-Jin Wei. 2020. “Measuring Smile Curves in Global Value Chains.” Oxford Bulletin of Economics and Statistics 82(5): 988–1016.
Meng, Bo and Ming Ye. 2022. “Smile Curves in Global Value Chains: Foreign- vs. Domestic-owned Firms; the US vs. China.” Structural Change and Economic Dynamics 60: 15–29.
Shih, Stan. 1996. Me-Too is Not My Style: Challenge Difficulties, Break through Bottlenecks, Create Values. Taipei: The Acer Foundation.
Waltz, Kenneth N. 1959. Man, the State and War. New York: Columbia University Press.
Waltz, Kenneth N. 1979. Theory of International Politics. Reading MA: Addison-Wesley Publishing Company.
Wang, Zhi, Shang-Jin Wei, Xinding Yu, and Kunfu Zhu. 2017. Characterizing Global Value Chains: Production Length and Upstreamness. NBER Working Paper 23261.
WTO. 2019. Global Value Chain Development Report 2019: Technological Innovation, Supply Chain Trade and Workers in a Globalized World. Washington, D.C.: World Bank.
Xiao, Hao, Bo Meng, Jiabai Ye, and Shantong Li. 2020. “Are Global Value Chains Truly Global?” Economic Systems Research 32(4): 540–64.
Xing, Yuqing, and Neal Detert. 2010. How the iPhone Widens the United States Trade Deficit with the People’s Republic of China. ADBI Working Paper 257.
*The views expressed in the columns are those of the author(s) and do not represent the views of IDE or the institutions to which the authors are attached.
i The concept of the smile curve was first proposed around 1992 by Stan Shih, the founder of Acer, a technology company headquartered in Taiwan.
ii Due to the differences in comparative advantages across countries participating in GVCs, rich countries might tend to engage in high-end and intangible production activities in the upstream stages and after-sales services and marketing in the downstream stages. Therefore, rich countries might worry about the hollowing out of their economies as manufacturing jobs are offshored to low-technology and low-wage countries. Moreover, poor countries might tend to focus on low-end and tangible production activities and might therefore have concerns that they are getting the wrong types of jobs and that their economies might be locked into GVCs at the bottom (low-end) of the so-called “smile curve.” (Baldwin, Ito, and Sato 2014).