
IDE Research Columns
Column
Data Out of the Blue: Using Remote Sensing Data in Economics
In recent years, the application of data acquired by satellites has proliferated beyond security and earth observation purposes. Satellite-based positioning systems, such as GPS, are an integral part of global IT and many businesses. Although we have been aware of their potential benefits for decades, the application of remote sensing data in the economic literature has advanced slowly. This short article proceeds as follows. First, it digests the expansion of satellite data and its application. Second, it summarizes the recent application of remote sensing data (most of which was accelerated because of the COVID-19 pandemic) by the author and his colleagues. Third, it concludes with recommendations to promote the application of satellite data in economics.
Slow Remote Sensing Data Exploitation in Economics
As of January 5, 2022, 12,480 satellites had been put into orbit, out of which 7,840 are still in space, and 5,000 are active.i About 63% of active satellites are for communication, 25% for earth and space science (e.g., weather), 9% for research, and 3% for navigation. Since the 1990s, the number of newly launched satellites has grown, but it jumped to more than 1,000 in 2000 and 2021, most of which belong to the USA (Figure 1). The Global Positioning System (GPS), which comprises about 30 satellites in orbit, is an indispensable part of the global IT business and almost any other business that claims to be smart. Authorities in the EU have started using satellites to monitor crop production and to check the validity of farmers' applications for subsidies.
Figure 1: Number of Operational Satellites by Selected Countries

Source: UCS Satellite Database (last updated on September 1, 2021).
Croft, a scholar on solar physics, pointed out that nighttime light (NTL) observed by weather satellites reflects human economic activities on the ground as early as 1978. It took almost two decades before Elvidge and his colleagues published a paper that investigates it statistically (Elvidge et al. 1997). It took another decade for mainstream economists to start to explore remotely sensed NTL data (Henderson et al., 2012). Since then, many economists have followed suit, but despite the richness of the information and data frequency, the application of remote sensing data in economics is still mostly limited to yearly average NTL.
Arguing that there are economic activities that emit less or even no light at night, Keola, Anderson, and Hall (2015) proposed land cover data generated from satellite imagery to better capture economic growth in rural areas, especially developing countries. Besides NTL, the use of land cover data and other types of remote sensing data is still rarely seen in economic journals. Meanwhile, Google Earth Engine alone currently hosts more than 29 petabytes (29 million gigabytes) of more than 600 data sets, while adding more than 100 new free-to-use remotely sensed data sets every year.ii Social scientists, including economists, are apparently slow to take advantage of the rapidly accumulating remote sensing data.
Assessing the Impacts of the COVID-19 Pandemic with Remote Sensing Data
Since 2020, Keola and Hayakawa published a series of new studies using remotely sensed air pollutants to monitor the impacts of COVID-19 on national and regional economies in developing countries and the world. For example, Keola and Hayakawa (2021) measured the impacts of lockdowns in 173 countries from January 1 to July 31 using daily nitrogen dioxide (NO2) observed by the TROPOspheric Monitoring Instrument (TROPMI) put into orbit by the European Space Agency (ESA) in 2017. They found that NO2 decreased in East Asia and the Pacific because of the workplace lockdown policy but increased in high-income countries and other parts of the world. Major sources of NO2 include fuel burning by vehicles, thermal power plants, and factories. The strong relationship between GDP and NO2 at the country level in 2019 is illustrated in Figure 2.
Figure 2: Correlation between NO2 and GDP in 2019
Source: Keola and Hayakawa (2021)
China and several developing countries in East Asia are currently major global manufacturing bases, many of which still depend on energy sources unfriendly to the environment. Households are the main source of NO2 in Europe, producing NO2 through the following major sources: vehicles, indoor gas stoves, and kerosene heaters. Although they did not investigate further, the differences between the major sources of NO2 may be responsible for the different impacts on NO2 after the workplace closure.
Figure 3: The Average NO2 Emission from January to October (2020/2019)
")
Source: Authors’ compilation using TROPOMI’s data and Global Administrative Unit
Layers (GAUL) provided by FAO. Hayakawa and Keola (2021).
Hayakawa and Keola (2021) examined the short-lived recovery from the pandemic in the latter half of 2020. They investigated the impacts of NO2 and two other air pollutants—carbon monoxide (CO) and formaldehyde (HCHO)—at the subnational level, which were weighted by more than 200,000 points of interest (POI), such as industrial sites, accommodations, businesses, restaurants, education, tourism, and transportation facilities, extracted from OpenStreetMap.iii Figure 3 illustrates how the reduction of NO2 at the subnational level in 2020 as compared with that of 2019 was captured by TROPOMI’s data. The study found that in the first half of 2020, air pollutants decreased in nearly all regions of most studied countries, except in Australia and New Zealand. The country-level study conducted by Keola and Hayakawa (2021) confirms this finding. The increase in air pollutants in Australia and New Zealand is likely due to large-scale forest fires (a non-economic event) that last from Autumn 2019 to Spring 2020. Judging from the increase in air pollutants in areas containing a substantial number of each type of POI after the first lockdown in 2020, the study also found that recovery in ASEAN forerunners (Brunei, Indonesia, Malaysia, Philippines, Singapore, and Thailand) was quick at tourism sites but slow at cropland, industrial, accommodation sites.
Figure 4. Monthly Average NTL in the Greater Tokyo Area

Source: Authors’ compilation using VNP46A2 NTL data and administrative boundary
provided by Japan’s Ministry of Land, Information, Transport, and Tourism.
Hayakawa, Keola and Urata (2021) applied one of the finest NTL datasets published by NASA to investigate the impact of policy on the business operation of restaurants. They found that the shorten-business-hour order significantly decreased NTL in regions with many restaurants, indicating the effectiveness of the order and its negative economic/business impacts on restaurants (Figure 4). In addition, they found that the order increased the NTL of residential areas.
Inter-disciplinary and international collaborations are required to promote the application of remote sensing data in economics
The spatial resolution of these data ranges from a square of several kilometers to 500 meters. The latest data available are from the previous week till the day prior to the date of checking, and the cost of obtaining them is virtually free. Therefore, they are potentially useful for research on developing regions and countries, where ground-based statistics are limited or unavailable. This is particularly true for policy-oriented research where timeliness is vital. During the current COVID-19 pandemic, where physical mobility is restricted globally, the benefits of such research extend beyond what will be enjoyed by developing countries. Nevertheless, much is still needed for the potential to be substantially materialized. First, the application of remote sensing data in economics would not progress if economists are not interested in it. There is plenty to be explored to link images captured and digitalize numbers sensed by satellites into sensible economic indicators. Interdisciplinary collaboration is likely to be very important, as storing and processing remote sensing data require hardware and software that are often beyond the research environment of social sciences institutions. Second, although scientific investigation using remote sensing data exploded after the USA government made images acquired by Landsat, the longest and continuous satellite mission with global coverage since 1972, open to the public in 2008, further action by the USA and other countries would undoubtedly push the application of remote sensing data to the next level. Since the initial cost of acquiring the data is enormous, international dialogues and cooperation are deemed indispensable for this to happen.
References
Croft, Thomas A. 1978. “Nighttime Images of the Earth from Space.” Scientific American 239(1): 86–101.
Elvidge, C.D., K. E. Baugh, E. A. Kihn, H. W. Kroehl, E. R. Davis, and C. W. Davis.
1997. “Relation between Satellite Observed Visible-Near Infrared Emissions, Population, Economic Activity and Electric Power Consumption.” International Journal of Remote Sensing 18(6): 1373–13799.
Hayakawa, Kazunobu, and Souknilanh Keola. 2021. “How is the Asian Economy Recovering from COVID-19? Evidence from the Emissions of Air Pollutants.” Journal of Asian Economics 77: 101375.
Hayakawa, Kazunobu, Souknilanh Keola, and Shujiro Urata. 2021. “How Effective Was the Restaurant Restraining Order against Covid-19? A Nighttime Light Study in Japan.” IDE Discussion Paper 822.
Henderson, J. Vernon, Adam Storeygard, and David N. Weil. 2012. “Measuring Economic Growth from Outer Space.” American Economic Review 102(2): 994–1028.
Keola, Souknilanh, Magnus Andersson, and Ola Hall. 2015. “Monitoring Economic Development from Space: Using Nighttime Light and Land Cover Data to Measure Economic Growth.” World Development 66: 322–34.
Keola, Souknilanh, and Kazunobu Hayakawa. 2021. “Do Lockdown Policies Reduce Economic and Social Activities? Evidence from NO2 Emissions.” The Developing Economies 59(2): 178–205.
*The views expressed in the columns are those of the author(s) and do not represent the views of IDE or the institutions to which the authors are attached.
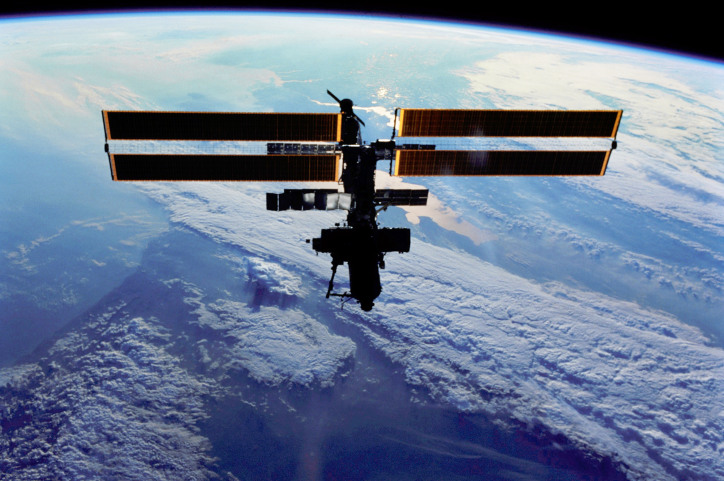
Thumbnail photo: ADCB5B Satellite In Space Orbiting Above Earth (Aflo)