

Geo-Economic Dataset for Asia
Data Sources and Notes : Taiwan
Administrative Divisions
In the Taiwanese geographical segmentation, the primary administrative division consists of 22 cities or counties including five special municipalities (Kaohsiung, New Taipei, Taichung, Tainan, and Taipei). The administrative division is modified every year in Taiwan. The above segmentation started from 25th December, 2010. For example, Kaohsiung city existed since before 2010, but its geographical area has expanded because Kaohsiung city and Kaohsiung province were merged in 2010. In GEDA, we adopt the primary administrative division as of 2005, which includes 25 cities or counties.
GDP
Regional value added data for all industries except agriculture are obtained from “The report on industrial and commercial census Taiwan-Fukien area, the Republic of China,” in which, for example, regional manufacturing GDP is available at the detailed sector level. Regional GDP for agriculture is computed by multiplying the share of each region’s cultivated area in total cultivated area by the national GDP for agriculture. The data on cultivated area by region and national GDP for agriculture are drawn from the “Agricultural, forestry, fishery, and animal husbandry census.” The sum of these sector-level regional GDP values is adjusted to be consistent with the sector-level national GDP data. However, the regional differences in GDP per capita constructed in this manner are more than 10 times in maximum. In order to modify this, we adjust sector-level regional GDP data as follows. First, we assume
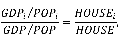
where GDPi is region i’s GDP, POPi is region i’s population, GDP is the national GDP, POP is the total population in Taiwan, HOUSEi is region i’s average disposable income per capita, and HOUSE is the average disposable income per capita in Taiwan. The data on average disposable income per capita by region are drawn from the National Statistics website: http://ebas1.ebas.gov.tw/pxweb/Dialog/statfile9.asp . By employing the above equation, we calculate each region’s total GDP. The regional differences in GDP per capita, based on the calculated regional GDP, are consistent with those in average disposable income per capita, which lie in a reasonable range. Second, the above computed sector-level regional GDP is adjusted to be consistent with this calculated regional GDP in total.
Population
Data are taken from the Statistical Yearbook of the Interior, which reports the population according to sex, age, and education level at the district level.
Area
Data are taken from the Statistical Yearbook of the Republic of China 2005.
