


A Note on Turning Points of Indian Economy
政策提言研究
※以下に掲載する文章は、平成24年度政策提言研究「中国・インドの台頭と東アジアの変容」第1回研究会(2012年5月11日開催)における報告内容を要約したものです。
PDF (95KB)
Economic policy of India since Independence changed with economic crises defining the turning point in 1957, 1961-62, 1965-66, 1974, 1979-80, and 1991. These crises were, among others, the balance of payment crises. Balance of payment crises of 1957 and 1961-62 during Nehru era both resulted in strengthening of economic regulation, especially strengthening of trade regulation. On the contrary, in cases of the economic crises of 1965-66, 1974 and 1979-80, there appeared a new response that promoted economic liberalization. According to Bhagwati and Srinivasan (1975) the politico-economic crisis of 1965-66 led to a strengthening of regulation under the political pressures of anti-US movement. Although the policy responses were different, the main reason for the balance of payment crises from 1957 to 1979-80 was the shortage of food grain. On top of this various exogenous factors such as war and oil crisis aggravated the crisis.
But, in case of 1985 liberalization under Rajiv Gandhi and the politico-economic crisis of 1991, we cannot see such an oft-repeated “traditional pattern”: starting from drought, resulting in food grain shortage and steep rise in prices, and triggering balance of payment crisis. For the most part, the government responded to these crises either by strengthening economic regulation up to 1966 or promoting economic liberalization since 1974. But, there was no balance of payment crisis at the time when Rajiv Gandhi promoted economic liberalization in 1985, and the main reason for the balance of payment crisis in 1991 was not food grain shortage. These facts suggest that something has changed during the period from the late 1970s to early 1980s.
2 Turning Points of Economic Growth in the Long-run
Deepak Nayyar suggests that in seeking turning points in Indian economic performance, it is not appropriate to evaluate them just focusing on the period since 1950; rather they should be situated in a longer-run historical perspective from the colonial era (Nayyar 2006).
The Indian economy stagnated in the colonial period. The most reliable estimate of economic growth rates from the colonial period up to today is that of Sivasubramonian (2000). According to his estimate, the growth rate of GDP from 1900-01 to 1946-47 was 0.93-1.05 per cent, and that of per capita GDP was 0.14-0.25 per cent. However, the growth rate of GDP from 1950-51 to 1964-65 substantially increased to 4.0 per cent and that of per capita GDP 1.9 per cent. If we compare sectoral growth rates, in the colonial period the growth rate of the primary sector was 0.41-0.42 per cent, that of the secondary sector was 1.54-1.72 per cent, and that of the tertiary sector was 1.72-1.73 per cent; but in the Nehru era growth rate of the primary sector increased to 2.6 per cent, that of the secondary sector to 6.8 per cent, and that of the sector to industry 4.5 per cent. It is notable that not only did the growth rate of the primary sector increase six times compared to the colonial period but the growth rate of the secondary sector exceeded that of the tertiary sector. Nayyar concluded that the most important structural break for the growth rate occurred in 1951-52. We can call this the first turning point of economic growth in the modern Indian history. Nayyar continued that the turning point in the growth trend since Independence was circa 1980, more than a decade before 1991 economic liberalization. This is the second turning point of economic growth in the modern Indian history. He divided the period from 1950-51 to 2004-05 into two sub-period from 1950-51 to 1979-80 and that of 1980-81 to 2004-05, and estimated growth rate of GDP of each period as 3.5 per cent for the first period and 5.6 per cent for the second period.
Using the more rigorous Bai and Perron method to find out structural breaks, which can estimate simultaneously multiple structural breaks in a series, Balakrishnan and Parameshwaran concluded that the structural break of growth rate of GDP occurred only once in 1978-79. The factors of accelerating growth rate since 1978-79 were acceleration of growth in the primary and services sectors, and the growth rate of manufacturing sector accelerated after the other sectors. This suggests that services-led growth started at least twenty years before 1991 (Balakrishnan and Parameshwaran 2007).
Nayyar and Balakrishnan & Parameshwaran made clear that it is undeniable that the most important turning point of economic growth in India is circa 1950 and the biggest turning point for economic growth is circa 1980. These findings are valuable; however, we cannot read nuances of history only from analysing the growth trend.
3 Transition from a Supply-constrained Economy to Demand-led Economy
Development economics during 1950s and 1960s, using a broadly structuralist approach, attended Indian development experience and conversely, Indian development planners and economists were under the influence of structuralist development economics 1 . Among others, “economic development with unlimited supply of labour” of W. Arthur Lewis, “take-off” theory of W. W. Rostow, “big-push” theory of P. N. Rosenstein-Rodan, and export pessimism of Hans Singer exerted a huge influence on planning of the Nehru era. For those development economists of the early period, the “turning point” meant a critical or jumping process or point from the low-level income equilibrium. Rostow described this process as “the take-off” from the traditional society and he assumed that after the take-off, “self-sustaining growth” could be attained (Rostow 1956). On the other hand, Lewis understood the turning point of the economy as the period when unlimited supply of labour vanished and after the turning point the real wages would rise in response to demand. Although Rostow’s and Lewis’ approaches are different, they shared a common understanding: both thought that capital scarcity is the most crucial factor leading to low-level equilibrium. And Lewis understood “the central problem in the theory of development” as “the process by which a community which was previously saving and investing 4 to 5 per cent of its national income or less, converts itself into an economy where voluntary saving in running at about 12 to 15 per cent of national income or more”(Lewis 1954). On the other hand Rostow also understood the most important definition of the take-off of the economy as “a rise in the rate of productive investment from (say) 5 per cent or less to over 10 per cent of national income (or net national product)” (Rostow 1956). Both attached importance to capital accumulation (saving and investment) as the most crucial factor that made possible economic growth.
On the other hand, there was a big difference in their understanding of the role of agriculture in the development process. Rostow thought the steep rise of agricultural production (agricultural revolution) was a necessary precondition for the take-off (Rostow 1960). He believed that for industrialization, more than industrialization was necessary and during the period of the take-off, agriculture must increase food supply to the industrial sector, expand the market for industrial goods, and increase loanable funds to the modern sector. By contrast, Lewis understood that the increase of agricultural productivity in the traditional subsistence sector would increase the real wage rate in the modern capitalist sector and as a result would decrease profit (economic surplus) in the capitalist sector, and finally would hamper the possibility of economic development using the low-level wage labourers, that is the unlimited supply of labour with subsistence-level wage.
Evaluating the Nehru-Mahalanobis development framework, Chakravarty commented that it was better viewed as “a variant of the Lewis model” (Chakravarty 1987, p.14). The variation relates firstly to the introduction of the two sector model by Mahalanobis and secondly to the role in development that was assigned not only to capitalists but also to bureaucracy. Also he pointed out that in the Nehru-Mahalanobis development framework, the possibility that domestic demand would constrain economic development was never considered. The Nehru-Mahalanobis development framework attached importance only to the supply-side constraints. And this is the reflection of the supply-constrained economy during the Nehru era.
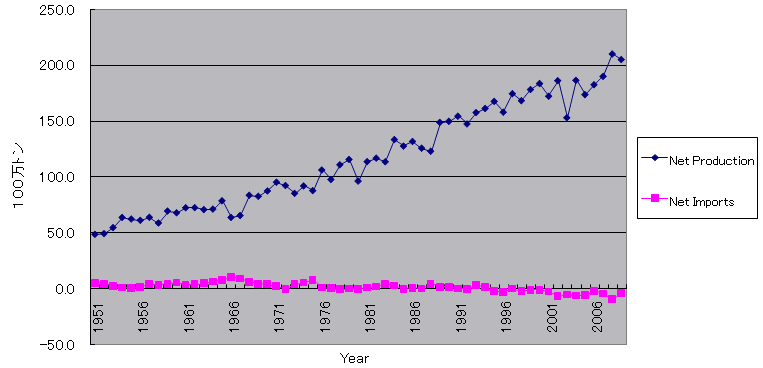
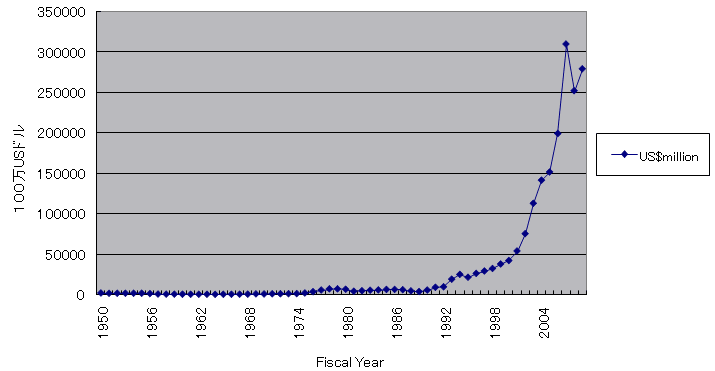
Then when did the supply-constrained economy vanish? And what does “the self-sustaining economy” after “the take-off” or “the turning point” looks like? To investigate these issues it is useful to see some indicators such as savings/investment ratio, agricultural production, and foreign exchange reserves.
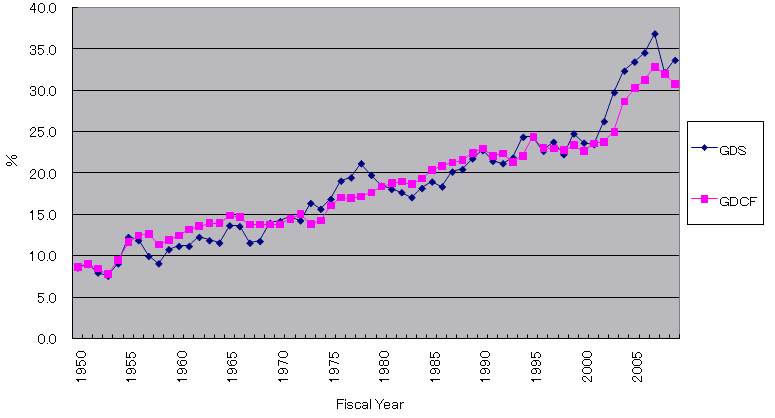
Figure 1 shows the trend of gross domestic saving and gross fixed capital formation as per cent of GDP from 1950-51 to 2009-10. If the long-term incremental capital-output ratio is around 4 (Mohan 2008), then a 5% growth rate can be attainable when the gross fixed capital formation reaches 20% of GDP. And if we suppose secular 5% annual growth rate as a minimum standard necessary for the take-off, then it was 1985 when the fixed capital formation exceeded 20%. On the other hand it was 1978 when the gross domestic saving rate exceeded 20%. However, it was reduced to less than 20% after that and it was 1987 when the gross domestic saving rate exceeded 20% again. Then we can say that during 1980 to 1985, the Indian economy took off.
(As per cent of GDP)
|
Source: GOI 2011, p. A10.
|
|
Source: GOI 2011, p. A22.
|
|
Source: GOI 2011, p. A70.
|
|
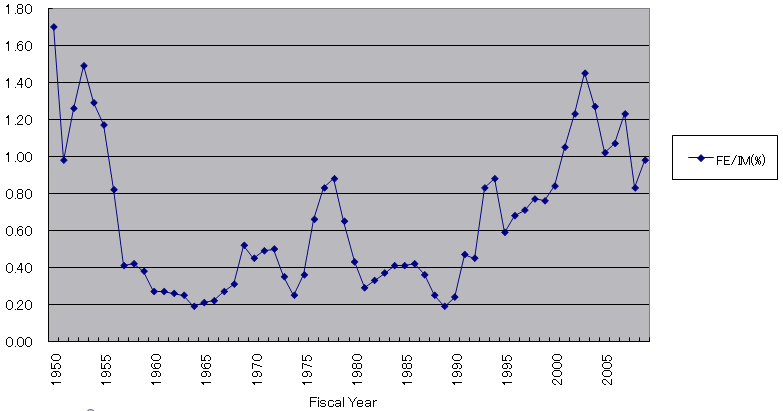
Source: GOI 2011, pp. A70, A81.
|
Turning points in terms of economic policy, economic growth and economic structure do not necessarily occur simultaneously, although turning points in these three dimensions have some close connections.
It is quite natural that the turning points in terms of economic policy do not coincide with those of economic growth. It takes time to implement a new economic policy. There are time-lags to set up new institutions or organizations and to adjust markets to realize new economic policy. On top of this, economic policy is one of the important factors to influence economic growth but surely not the only one. Also it is clear that turning points of economic policy do not coincide with that of economic structure. Because the change of economic structure is a long-run historical process, we can not specify the date. However, it is clear that from the late 1970s onwards India gradually overcame the supply-side shortages of 1950s and 1960s, and as economic liberalization progressed during 1980s and 1990s India become a more and more demand-led economy. It was the green revolution that brought the beginning of this transformation and after that the service revolution followed by increasing income, savings, and capital formation.
Reference
- Agarwala, A. N. and S. P. Singh eds. 1958, The Economics of Underdevelopment , London: Oxford University Press.
- Balakrishnan, Pulapre and M. Parameswaran 2007. “Understanding Economic Growth in India: A Prerequisite,” Economic and Political Weekly , July 14.
- Bhagwati, Jagdish and T. N. Srinivasan 1975, Foreign Trade Regimes and Economic Development: India , New York and London: Columbia University Press.
- Chakravarty, Sukhamoy 1987, Development Planning: The Indian Experience , Oxford: Clarendon Press.
- GOI (Government of India) 2011. Economic Survey 2010-11 , New Delhi: GOI.
- Lewis, Arthur 1954. “Economic Development with Unlimited Supply of Labour,” The Manchester School , May. Reprinted in Agarwala and Singh eds. 1958.
- Mohan, Rakesh 2008. “Growth Record of The Indian Economy, 1950-2008: A Story of Sustained Savings and Investment,” Economic and Political Weekly , May 10.
- Nayyar, Deepak 2006, “Economic Growth in Independent India: Lumbering Elephant or Running Tiger?” Economic and Political Weekly , April 15: 1451-1458.
- Rostow, W. W. 1956. “The Take-off into Self-sustaining Growth,“ The Economic Journal , March, reprinted in Agarwala and Singh eds. 1958.
- Rostow, W. W. 1960. The Stages of Economic Growth: A Non-Communist Manifesto , London: Cambridge University Press.
- Sivasubramonian, S. 2000. The National Income of India in the Twentieth Century , New Delhi: Oxford University Press.
- The standard text of development economics in those days was A. N. Agarwala and S. P. Singh eds., The Economics of Underdevelopment (Agarwala and Singh 1958), which is packed papers of the structuralist economists.